Published
New Census Bureau data show rising purchasing power in 2025, while nearly six decades of income history reveal setbacks, recoveries, and persistent differences between households. American household income reached a new inflation-adjusted high in 2025. But the longer history shows that financial progress rarely follows a straight line and that a rising national median does not mean every household is gaining ground.
According to the Census Bureau’s Income in the United States: 2025, median household income increased to $87,460, up 2.6 percent from $85,210 in 2024.
Both figures are expressed in 2025 dollars. The increase therefore represents greater purchasing power, rather than simply more dollars needed to keep up with inflation.
Chart: Real median household income by race and Hispanic origin, 1967–2025. Source: U.S. Census Bureau, Figure 2.
A Long-Term Rise Interrupted by Setbacks
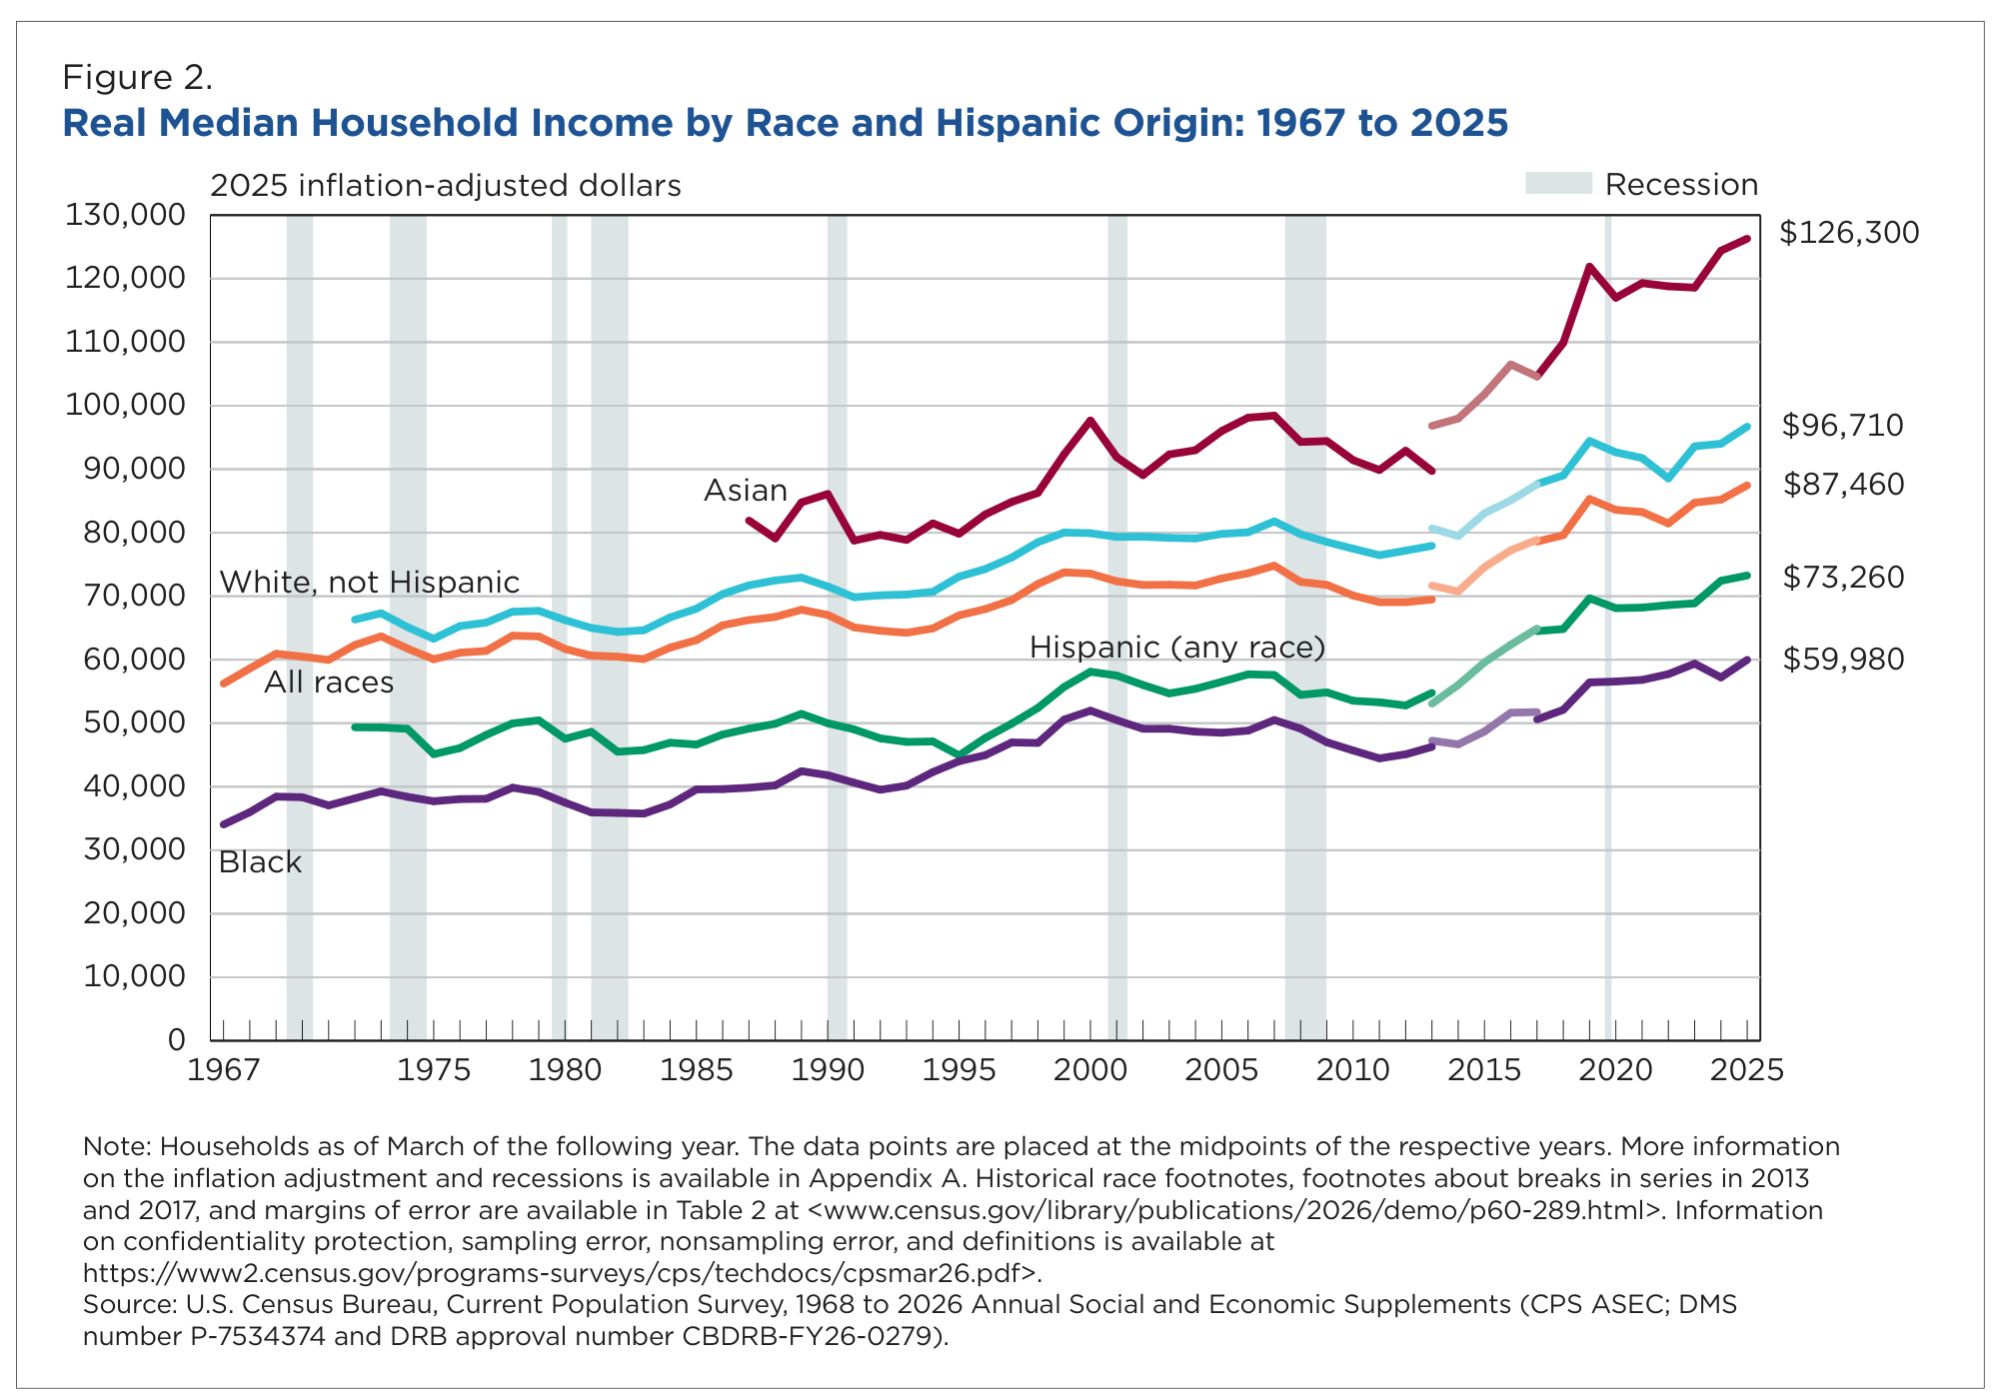
Figure 2 from the Census Bureau's report traces household income back to 1967. The broad direction is upward, but the chart also shows extended periods when inflation-adjusted incomes stalled or declined.
The recessions of the early 1980s and early 1990s interrupted earlier gains. Income rose during the late 1990s, weakened during the following decade, and suffered another setback around the Great Recession.
A stronger recovery emerged during the 2010s, followed by another disruption around the pandemic. The latest increase places national median household income above its earlier peaks.
That history matters because households experience the years between those peaks. A decade of weak income growth can affect the ability to save for a down payment, build an emergency fund, or contribute to retirement even if income eventually recovers.
The chart also identifies breaks in the statistical series, including changes in 2013 and 2017. Those changes warrant care when interpreting movements across the full historical period.
Recent Gains Differed Across Groups
The 2025 results show substantial differences in household income levels:
| Household category | Median income in 2025 | Change from 2024 |
|---|---|---|
| All households | $87,460 | +2.6% |
| White, non-Hispanic | $96,710 | +2.9% |
| Black | $59,980 | +4.8% |
| Asian | $126,300 | No statistically significant change |
| Hispanic, any race | $73,260 | No statistically significant change |
Amounts are in 2025 dollars. Race and Hispanic origin reflect the householder’s characteristics. Hispanic households may be of any race.
Black households experienced a statistically significant income increase, as did non-Hispanic White households. However, the report found that differences between the racial and ethnic groups’ annual percentage changes were not statistically significant. The results therefore do not establish that one group’s income grew faster than another’s.
The longer-term chart shows rising incomes across the groups displayed, alongside persistent gaps. It does not, by itself, explain those differences. Household size, the number of earners, age, education, employment, and other characteristics can all affect household income.
After-Tax Income Also Improved
The report’s headline measure is pretax money income. It excludes the value of noncash benefits and does not subtract income or payroll taxes.
A separate measure accounts for federal and state income taxes, tax credits, and payroll taxes. On that basis, median post-tax household income increased 3.1 percent, rising from $73,760 in 2024 to $76,060 in 2025.
That provides additional evidence of improved household resources. However, the difference between the 3.1 percent post-tax increase and the 2.6 percent pretax increase was not statistically significant.
Higher Income Did Not Produce a Broad Decline in Inequality
The national median can rise while differences between households remain large.
The Census Bureau found no statistically significant change in overall pretax income inequality between 2024 and 2025, as measured by the Gini index.
Income at the 90th percentile increased 1.7 percent, while income at the 10th percentile did not change significantly. In 2025, those income thresholds were $261,300 and $20,010, respectively.
The highest-income fifth of households received 52.4 percent of aggregate household income, compared with 3 percent for the lowest-income fifth.
Taxes and credits reduced measured inequality: the post-tax Gini index was 8.7 percent lower than the pretax measure in 2025. That is a comparison of two income measures within the same year, rather than an annual decline in inequality.
What a Record Income Means for Household Finances
A record inflation-adjusted median is meaningful. It indicates that purchasing power at the midpoint of the household income distribution improved.
But it is not a measure of wealth, financial security, or the income of the same household over time. The survey compares populations whose composition changes from year to year.
Nor does the national inflation adjustment capture every household’s experience. Families facing unusually large increases in housing, insurance, healthcare, or other expenses may feel less improvement than the headline suggests.
The latest report offers encouraging evidence of income growth. Its historical perspective adds an equally important lesson: sustained gains matter more to household financial security than a single record year.