Tue, 29 December 2020 | housing real estate
The median home sale price increased 14% year over year to $320,714 during the 4-week period ending December 20, according to a new report from Redfin (redfin.com), the technology-powered real estate brokerage.
Below are other key housing market takeaways for 400+ U.S. metro areas during the 4-week period ending December 20.
"Going into the new year, it will truly be out with the old, because there will be very few homes from 2020 left on the market," said Redfin chief economist Daryl Fairweather. "So those who resolve to buy a home in 2021 may need to wait with bated breath for sellers to list their homes. Redfin's forecasts suggest the new year will bring many more new listings, but they will likely be snatched up quickly. So if you are a homebuyer, now is a good time to get pre-approved for a mortgage, and come up with your wishlist, so you can act quickly when your dream home hits the market."
To view the full report, including charts and methodology, please visit: https://www.redfin.com/news/housing-market-update-december-20/
Source: Redfin
Tue, 29 December 2020 | housing real estate
S&P Dow Jones Indices reported today that annual home price gains remained strong through October. The S&P CoreLogic Case-Shiller U.S. National Home Price NSA Index, covering all nine U.S. census divisions, reported an 8.4% annual gain in October, up from 7.0% in the previous month. The 10-City Composite annual increase came in at 7.5%, up from 6.2% in the previous month. The 20-City Composite posted a 7.9% year-over-year gain, up from 6.6% in the previous month.
Phoenix, Seattle and San Diego continued to report the highest year-over-year gains among the 19 cities (excluding Detroit) in October. Phoenix led the way with a 12.7% year-over-year price increase, followed by Seattle with an 11.7% increase and San Diego with an 11.6% increase. All 19 cities reported higher price increases in the year ending October 2020 versus the year ending September 2020.
MONTH-OVER-MONTH
The National Index posted a 1.4% month-over-month increase, while the 10-City and 20-City Composites both posted increases of 1.4% and 1.3% respectively, before seasonal adjustment in October. After seasonal adjustment, the National Index posted a month-over-month increase of 1.7%, while the 10-City and 20-City Composites both posted increases of 1.6%. In October, all 19 cities (excluding Detroit) reported increases before and after seasonal adjustment.
ANALYSIS
"The surprising strength we noted in last month's report continued into October's home price data," says Craig J. Lazzara, Managing Director and Global Head of Index Investment Strategy at S&P Dow Jones Indices. "The National Composite Index gained 8.4% relative to its level a year ago, accelerating from September's 7.0% increase. The 10- and 20-City Composites (up 7.5% and 7.9%, respectively) also rose more rapidly in October than they had done in September. The housing market's strength was once again broadly-based: all 19 cities for which we have October data rose, and all 19 gained more in the 12 months ended in October than they had gained in the 12 months ended in September.
"We've noted before that a trend of accelerating increases in the National Composite Index began in August 2019 but was interrupted in May and June, as COVID-related restrictions produced modestly-decelerating price gains. Since June, our monthly readings have shown accelerating growth in home prices, and October's results emphatically emphasize that trend. The last time that the National Composite matched this month's 8.4% growth rate was more than six and a half years ago, in March 2014. Although the full history of the pandemic's impact on housing prices is yet to be written, the data from the last several months are consistent with the view that COVID has encouraged potential buyers to move from urban apartments to suburban homes. We'll continue to monitor what the data can tell us about this question.
"Phoenix's 12.7% increase led all cities for the 17th consecutive month. Seattle (11.7%) and San Diego (11.6%) repeated in second and third place. Prices were strongest in the West and Southwest regions, but even the comparatively weak Midwest and Northeast (up 7.7% and 7.9% respectively) performed creditably well."
More than 27 years of history are available for these data series, and can be accessed in full by going to https://www.spglobal.com/spdji/.
Source: prnewswire.com
Thu, 31 December 2020 | housing
Homeownership is increasingly unaffordable in the U.S. according to a new report from ATTOM Data Solutions. ATTOM's fourth-quarter 2020 U.S. Home Affordability Report, shows median home prices of single-family homes and condos in the fourth quarter of 2020 were less affordable than historical averages in 55 percent of counties with enough data to analyze, up from 43 percent a year ago and 33 percent three years ago. Yet rising wages and falling mortgage rates still helped keep median home prices close to affordable for average wage earners across the country.
The report determined affordability for average wage earners by calculating the amount of income needed to make monthly house payments — including mortgage, property taxes and insurance — on a median-priced home, assuming a $100,000 loan and a 28 percent maximum "front-end" debt-to-income ratio. That required income was then compared to annualized average weekly wage data from the Bureau of Labor Statistics (see full methodology below, which has changed from earlier reports to account for higher down payments and two-worker households).
Compared to historical levels, 275 of the 499 counties analyzed in the fourth quarter of 2020, or 55 percent, were less affordable than past averages, up from 217 of the same group of counties in the fourth quarter of 2019 and 164 in the fourth quarter of 2017. The fallback came as continued spikes in median home prices of at least 10 percent over the past year in most of the country outpaced the impact of increasing wages and declining mortgage rates to historic lows. Those price increases occurred as the U.S. housing market kept booming despite economic troubles related to the ongoing Coronavirus pandemic.
With prices rising faster than earnings, major home-ownership expenses consumed 29.6 percent of the average wage across the nation during the fourth quarter of 2020. That figure was up from 26.4 percent in the fourth quarter of 2019 and was above the 28 percent benchmark lenders prefer for how much homeowners should spend on those major expenses – mortgage payments, insurance and property taxes. Those costs exceeded the benchmark in 59 percent of the counties included in the fourth-quarter 2020 report.
"Owning a home in the United States slipped into the unaffordable zone for average workers across the nation in the fourth quarter as the numbers continued a year-long slide in the wrong direction. The latest housing market data shows the average worker unable to meet the 28 percent affordability guideline used by lenders," said Todd Teta, chief product officer with ATTOM Data Solutions. "That's happened as home prices have continued rising throughout 2020 and the housing market has remained remarkably resilient in the face of the brutal economic fallout from the Coronavirus pandemic. The future remains wholly uncertain and affordability could swing back into positive territory. But for now, things are going in the wrong direction for buyers."
Among the 499 counties in the report, fewer than half (203) had major home-ownership expenses on typical homes in the fourth quarter that were affordable for average local wage earners. The largest of those counties, based on the 28-percent guideline, were Cook County (Chicago), IL; Harris County (Houston), TX; Philadelphia County, PA; Hillsborough County (Tampa), FL and Cuyahoga County (Cleveland), OH.
Report Methodology
The ATTOM Data Solutions U.S. Home Affordability Index analyzes median home prices derived from publicly recorded sales deed data collected by ATTOM Data Solutions and average wage data from the U.S. Bureau of Labor Statistics in 499 U.S. counties with a combined population of 232.4 million. The affordability index is based on the percentage of average wages needed to pay for major expenses on a median-priced home with a 30-year fixed rate mortgage and a $100,000 loan. Those expenses include property taxes, home insurance, mortgage payments and mortgage insurance. Average 30-year fixed interest rates from the Freddie Mac Primary Mortgage Market Survey were used to calculate the monthly house payments.
The report determined affordability for average wage earners by calculating the amount of income needed for major home ownership expenses on a median-priced home, assuming a $100,000 loan and a 28 percent maximum "front-end" debt-to-income ratio. For instance, the nationwide median home price of $297,200 in the fourth quarter of 2020 required an annual gross income of $64,447, based on a $100,000 loan and monthly expenses not exceeding the 28 percent barrier — meaning households would not be spending more than 28 percent of their income on mortgage payments, property taxes and insurance. That required income is more than the $64,447 average wage nationwide based on the most recent average weekly wage data available from the Bureau of Labor Statistics, making a median-priced home nationwide unaffordable for an average household with two wage earners.
Source: ATTOM Data Solutions press release
Tue, 05 January 2021 | housing demographics
Typical values for Black- and Latinx-owned homes still lag behind overall U.S. home values, but the gap is narrowing. A new Zillow® analysis shows homes owned by Black and Latinx households are worth 16.2% and 10.2% less, respectively, than the typical U.S. home -- gaps that have closed by about 4 percentage points from their widest points following the Great Recession. Homes owned by non-Hispanic white and Asian families, meanwhile, have typical values 2.9% and 3.7% higher than the typical U.S. home.
While inequity in home values continues to persist, the data show them steadily, albeit slowly, converging. Since homeownership is the single largest driver of wealth for many households, the value and appreciation of a home is extremely impactful for families.
Before the Great Recession, the gap between Black-owned home values and all home values was about 15%, but grew to 20% by March 2014. Similarly, Latinx-owned homes saw the largest home value gap in May 2012 at 14% -- 2 percentage points larger than before the housing bubble. Now, nearly a decade later, home values for Black- and Latinx-owned homes are back at pre-bubble levels, and continue to narrow despite the current economic crisis.
One reason for the wide gap is that the housing bust hit communities of color especially hard. Subprime loans were targeted to take advantage of the most vulnerable communities, and the ensuing wave of foreclosures hurt homeownership and home values disproportionately for Black and Latinx homeowners. Fast forward 12 years, and homeownership rates and home values are still recovering for these communities. While home value growth turned positive for U.S. homes in August 2012, it took an additional two years for Black and Latinx homes to see this same growth.
"It has taken nearly a decade for the home value gap to return to pre-recession levels, but still, the gap remains very large," says Zillow economist Treh Manhertz. "With Black and brown communities and jobs hit disproportionately hard in the pandemic, there has been reason to worry another dip may be on the horizon that could slow or stop the progress. However, this is not the case, as the same factors that widened the gap in the Great Recession are not surfacing this time. Thanks to rock bottom rates on the most secure mortgages, extended forbearance programs, and rising home prices, there are no signs of another widening of the gap coming this year. However, through these turbulent times, continued vigilance and targeted intervention by policymakers is crucial to keep the progress going for communities of color."
Home value inequality varies greatly in different states and metropolitan areas. Large metros with the smallest spread between Black-owned home values are Riverside (1% value gap), San Antonio (3%), Las Vegas (3%), and Portland (4%). Among the most unequal are Detroit (46% value gap), Buffalo (43%) Birmingham (43%), St. Louis (41%), and Milwaukee (40%).
Thu, 07 January 2021 | housing
The number of homes for sale in the U.S. reached an all-time low in December, dipping below 700,000 for the first time as buyers remained active throughout the holiday season, according to realtor.com®'s Monthly Housing Trends Report released today. Due to unusually strong demand, home prices were up double digits compared to last year, however, the median listing price came down to $340,000 from a summer high of $350,000.
"The shortage of homes for sale has been an ongoing issue for the last couple of years, but in December the combination of the holiday inventory slowdown and the pandemic buying trend caused it to dip to its lowest level in history," said realtor.com® Chief Economist, Danielle Hale. "Looking forward, we could see new lows in the next couple of months as buyers remain relatively active, but a surge of new COVID cases may slow the number of sellers entering the market. Newly listed properties have shown mixed trends. While December's data points to possible relief on the horizon, this figure has been impacted the most in areas with large COVID surges, and consistent improvement will be key in order to get out of this extreme shortage. We eventually expect to see improvements in the supply of homes for sale, especially in the second half of the year. Until then, finding a home will continue to be a top challenge for buyers across all price ranges."
The number of homes for sale reached a historic low as buyer demand remained strong
Nationally, the number of homes for sale was down 39.6%, amounting to 449,000 fewer homes for sale than last December. Newly listed homes were only down 0.8% compared to last year, a substantial improvement from November when new listings were down 8.7%. Western (+30.8%) and Northeastern larger markets (+15.0%) are seeing the strongest improvements with more new listings hitting the market, while the Midwest (+0.2%) and South (-4.0%) lagged behind. The West's surge in newly listed homes is primarily attributed to San Jose, Calif. (+123.8%) and San Francisco (+98.9%), which saw far more new listings this December compared to 2019.
Home prices continued to grow at double-digits, with the median listing price growing 13.4% year-over-year, to $340,000 in December. This is a slight step back from its peak of $350,000. While prices increased nationwide, the largest gains were seen in the Northeast (+12.2%), followed by the West (+10.4%), Midwest (+8.6%) and South (+6.7%).
Source: Realtor.com®
Thu, 07 January 2021 | housing interest rates
Owning a median-priced three-bedroom home is more affordable than renting a three-bedroom property in 572, or 63 percent of the 915 U.S. counties according to the new 2021 Rental Affordability Report from ATTOM Data Solutions. That has happened even though median home prices have increased more than average rents over the past year in 83 percent of those counties and have risen more than wages in almost two-thirds of the nation.
Home ownership is more affordable in almost two-thirds of the country following a year when the impact of declining interest rates helped counteract home prices that rose faster than rents and wages. Trends favoring home ownership show up most in suburban and rural areas with the most affordable home values, while renting remains more affordable in the biggest cities. Home ownership is more affordable than renting in counties with a population of less than 1 million, especially among those with less than 500,000 people. Owning is more affordable in 47, or 50 percent, of the 94 counties with 500,000 to 999,999 people. The largest in this group where it is more affordable to buy are St. Louis County, MO; Pinellas County (Tampa), FL; Milwaukee County, WI; Marion County (Indianapolis), IN and Shelby County (Memphis), TN. The largest in this group where it is more affordable to rent are Honolulu County, HI; Fresno County, CA; Westchester County, NY (outside New York City); Collin County, TX (outside Dallas) and Fairfield County (outside New York City), CT. Among the remaining 779 counties with a population less than 500,000, owning is more affordable in 510, or 65 percent. The largest in this group where owning is more affordable are Greenville County, SC; Adams County, CO (outside Denver); Lake County (Gary), IN; Hampden County (Springfield), MA and Clark County, WA (outside Portland, OR). The largest counties where renting is more affordable are Spokane County, (WA); Morris County, NJ (outside New York City); Polk County (Des Moines), IA; Richmond County (Staten Island), NY and Tulare County (Visalia), CA. Source: ATTOM Data SolutionsSun, 10 January 2021 | housing
The median home sale price increased 13% year over year to $319,000 during the 4-week period ending January 3, according to a new report from Redfin.
Below are other key housing market takeaways for 400+ U.S. metro areas during the 4-week period ending January 3.
"The economy faces new challenges in the next few weeks, which are likely to see continued political instability and rising coronavirus cases," said Redfin chief economist Daryl Fairweather. "Still, it's unlikely that either will have a meaningful or long-term impact on homebuying demand, which, already extremely strong, is now bolstered by even lower mortgage rates. Migration and progressive economic policies will shape the housing market in the months to come. The recent migration of Americans to affordable places like Atlanta, Phoenix and suburbs across the country has contributed to what will be a major change in fiscal and economic policy starting on January 20. While more government spending could lead to moderate mortgage-rate increases, it will also likely include programs to make homeownership affordable to more people."
Source: Redfin
Wed, 13 January 2021 | consumer expectations housing inflation
NEW YORK—The Federal Reserve Bank of New York's Center for Microeconomic Data released the December 2020 Survey of Consumer Expectations, which shows that median inflation expectations increased at the medium-term horizon, and remained unchanged at the short-term horizon. Uncertainty about future inflation increased slightly, remaining at an elevated level. Median home price change expectations increased sharply to its highest level since July 2018.
The main findings from the December 2020 Survey are:
Inflation
Labor Market
Household Finance
About the Survey of Consumer Expectations (SCE)
The SCE contains information about how consumers expect overall inflation and prices for food, gas, housing, and education to behave. It also provides insight into Americans' views about job prospects and earnings growth and their expectations about future spending and access to credit. The SCE also provides measures of uncertainty regarding consumers' outlooks. Expectations are also available by age, geography, income, education, and numeracy.
The SCE is a nationally representative, internet-based survey of a rotating panel of approximately 1,300 household heads. Respondents participate in the panel for up to 12 months, with a roughly equal number rotating in and out of the panel each month. Unlike comparable surveys based on repeated cross-sections with a different set of respondents in each wave, our panel allows us to observe the changes in expectations and behavior of the same individuals over time.
Source: Federal Reserve Bank of New York
Fri, 22 January 2021 | housing
Existing-home sales rose in December, with home sales in 2020 reaching their highest level since 2006, according to the National Association of Realtors®. Activity in the major regions was mixed on a month-over-month basis, but each of the four areas recorded double-digit year-over-year growth in December.
Total existing-home sales, https://www.nar.realtor/existing-home-sales, completed transactions that include single-family homes, townhomes, condominiums and co-ops, increased 0.7% from November to a seasonally-adjusted annual rate of 6.76 million in December. Sales in total rose year-over-year, up 22.2% from a year ago (5.53 million in December 2019).
"Home sales rose in December, and for 2020 as a whole, we saw sales perform at their highest levels since 2006, despite the pandemic," said Lawrence Yun, NAR's chief economist. "What's even better is that this momentum is likely to carry into the new year, with more buyers expected to enter the market."
Yun predicts a continuation of the strong activity that's currently taking place in the housing market and in the overall economy.
"Although mortgage rates are projected to increase, they will continue to hover near record lows at around 3%," Yun said. "Moreover, expect economic conditions to improve with additional stimulus forthcoming and vaccine distribution already underway."
The median existing-home price for all housing types in December was $309,800, up 12.9% from December 2019 ($274,500), as prices increased in every region. December's national price increase marks 106 straight months of year-over-year gains.
Total housing inventory at the end of December totaled 1.07 million units, down 16.4% from November and down 23% from one year ago (1.39 million). Unsold inventory sits at an all-time low 1.9-month supply at the current sales pace, down from 2.3 months in November and down from the 3.0-month figure recorded in December 2019. NAR first began tracking the single-family home supply in 1982.
Properties typically remained on the market for 21 days in December, seasonally even with November and down from 41 days in December 2019. Seventy percent of the homes sold in December 2020 were on the market for less than a month.
"To their credit, homebuilders and construction companies have increased efforts to build, with housing starts hitting an annual rate of near 1.7 million in December, with more focus on single-family homes," Yun said. "However, it will take vigorous new home construction in 2021 and in 2022 to adequately furnish the market to properly meet the demand."
First-time buyers were responsible for 31% of sales in December, unchanged from the same time in 2019, but down from 32% in November 2020. NAR's 2020 Profile of Home Buyers and Sellers – released in late 20204 – revealed that the annual share of first-time buyers was 31%.
Individual investors or second-home buyers, who account for many cash sales, purchased 14% of homes in December, identical to the share recorded in November 2020 and a small decline from 17% in December 2019. All-cash sales accounted for 19% of transactions in December, down from 20% in both November and December 2019.
Distressed sales – foreclosures and short sales – represented less than 1% of sales in December, equal to November's percentage but down from 2% in December 2019.
"NAR will work with the incoming Biden administration in pursuit of policies promoting housing affordability and accessibility," said NAR President Charlie Oppler, a Realtor® from Franklin Lakes, N.J., and the CEO of Prominent Properties Sotheby's International Realty. "We were pleased with the homebuyer tax credit President Biden proposed as a candidate and we look forward to continuing our work with Congress and the White House. We will aim to find common ground, especially related to ways of boosting home supply and working toward solutions that will protect and support homeownership and America's broader real estate industry."
According to Freddie Mac, the average commitment rate for a 30-year, conventional, fixed-rate mortgage decreased to 2.68% in December, down from 2.77% in November. The average commitment rate across all of 2020 was 3.11%.
Single-family home sales rose at a seasonally-adjusted annual rate of 6.03 million in December, up 0.7% from 5.99 million in November, and up 22.8% from one year ago. The median existing single-family home price was $314,300 in December, up 13.5% from December 2019.
Single-family and Condo/Co-op Sales
Existing condominium and co-op sales were recorded at a seasonally-adjusted annual rate of 730,000 units in December, up 1.4% from November and up 17.7% from one year ago. The median existing condo price was $272,200 in December, an increase of 6.9% from a year ago.
Regional Breakdown
Median home prices increased at double-digit rates in each of the four major regions from one year ago.
December 2020 saw existing-home sales in the Northeast climb 4.5%, recording an annual rate of 930,000, a 27.4% increase from a year ago. The median price in the Northeast was $362,100, up 19.0% from December 2019.
Existing-home sales in the Midwest were unchanged, recording an annual rate of 1,590,000 in December, but up 26.2% from a year ago. The median price in the Midwest was $235,700, a 13.7% increase from December 2019.
Existing-home sales in the South increased 1.1% to an annual rate of 2,860,000 in December, up 20.7% from the same time one year ago. The median price in the South was $268,100, an 11.3% increase from a year ago.
Existing-home sales in the West fell 1.4% from the month prior, recording an annual rate of 1,380,000 in December, a 17.9% increase from a year ago. The median price in the West was $467,900, up 14.2% from December 2019.
Source: National Association of Realtors
Fri, 22 January 2021 | data pandemic
As millions of Americans sheltered in place and shifted to working from home and remote learning during the COVID-19 pandemic, ongoing research from Comscore found that overall in-home data usage levels throughout 2020 remained significantly higher than in 2019.
Throughout the first several of months of COVID-related lockdowns, data consumption from Comscore Connected Home custom reporting showed increased usage across all connected devices; smart TVs, laptops, gaming consoles, phones, smart speakers, streaming boxes & sticks and tablets all saw strong growth in data usage versus 2019.
By the summer, year-over-year growth rates across all devices seemed to level off to around 15% on average, but smart TVs and home computers continued to see growth rates upwards of 30% versus 2019. Despite some schools reopening for in-person learning and some adults returning to their offices, at least part time, home computer data usage continued to accelerate through the end of the year.
As 2020 came to an end, year-over-year growth in data consumption during Q4 2020 slowed slightly – in-home data consumption increased at roughly the same rates seen in the weeks leading up to COVID closures. Overall, total in-home data consumption in 2020 increased 18% from the previous year.
Despite the cross-device year-over-year growth in data consumption, there was not much of a shift in how data consumption was allocated across devices in 2020 versus 2019. With the exception of a slight shift away from gaming consoles in favor of smart TVs in 2020, households continued to consume data in very similar ways to how they did in 2019.
Throughout the COVID-19 pandemic, consumers had adapted to a modified way of life. As lockdowns had eased, data consumption growth appears to have begun to slow in comparison to the peak months in early 2020. Comscore will continue to monitor these changing consumption habits on its Coronavirus Insights Hub. To learn more about how Comscore can provide you with custom insights, contact us today.
Source: Comscore
Fri, 22 January 2021 | housing
Home value growth continued its meteoric rise in December as towering demand for homes carried on into winter, according to Zillow's® latest Real Estate Market Report. Houses are going under contact quickly and sales far outpace the year prior as all-time low mortgage rates help keep monthly payments manageable, despite rising prices.
Typical home values in the U.S. climbed to $266,104, up 8.4% from a year ago -- the highest annual increase since January 2014.
Home value growth over the last quarter in the U.S. was 3.2% -- higher than at any time since the Zillow Home Value Index (ZHVI) series began in 1996. Many metros took part in this late surge in appreciation as the nation's housing market rode a wave of high demand deep into the winter. The Sun Belt produced growth standouts including Austin -- the metro predicted to be hottest in 2021 -- which saw 5.3% growth over the previous quarter, while Phoenix, San Diego, and Salt Lake City all clocked 5.1% growth.
"The housing market ended 2020 with an exclamation point, as home values rose sharply near the end of the year at their fastest quarterly rate on record," said Jeff Tucker, senior economist at Zillow. "Sales are taking place at a rapid clip as momentum gathering in the market since June is still pushing forward at full force and is expected to continue for the foreseeable future. Although prices are skyrocketing, record-low mortgage rates keep bringing buyers to the table by keeping monthly payments in reach."
Phoenix led all major metros in yearly home value growth, up 15.3% compared to last December. It snatched the lead away from San Jose -- up 15.2% year over year -- and stayed ahead of Salt Lake City (13.2%), Seattle (13%) and Austin (12.9%).
Monthly home value growth for the U.S. held steady at 1.1%, as it was in November. This is the fastest month-over-month growth in the series history reaching back to 1996. Monthly growth ranged from 0.6% in Las Vegas to 1.8% in Salt Lake City.
Rents nationwide are up 0.2% since November to $1,740, continuing a slow recovery from a yearly low in October of $1,728. Annual rent growth was stunted in 2020, rising just 0.8% -- equivalent to $14 -- year over year. In December of 2019 rents were climbing at 3.5% annually.
Downward slides in rent reversed course late in 2020 in markets like Washington, DC - up 0.2% month over month in December, Boston (0.4%), Los Angeles (0.2%), Chicago (0.2%), and San Jose (0.6%). The rent recovery is broad-based, with positive monthly changes across the U.S. as a whole and in 77 of the largest 100 MSAs for which rent has been measured. In San Francisco (-0.6%), Seattle (-0.8%), and New York (-0.4%), the bottom is still to come, but monthly rent decreases are gradually slowing.
For-sale listings' median time on market for the U.S. stayed extremely short at 14 days, just one day longer than monthly lows in the fall. Newly pending sales are following seasonal trends, but remain elevated -- up 21.7% compared to last year despite available inventory down 26.6%.
Mortgage rates listed by third-party lenders on Zillow reached an all-time low of 2.63% on Dec. 18. Rates entered December at an extraordinarily low 2.71%, hit a monthly high of 2.79% on Dec. 25 and ended the month at 2.75%. Even as prices rose late in 2020, record low mortgage rates have made monthly payments more affordable for buyers. Rates are currently on an upward trend, but are still far below long-term averages.
Source: Zillow
Thu, 28 January 2021 | housing
Home sellers nationwide in 2020 realized a home-price gain of $68,843 on the typical sale, up from $53,700 in 2019 and $48,500 two years ago, according to a new report from ATTOM Data Solutions. Profits rose in more than 90 percent of housing markets with enough data to analyze and the latest figure, based on median purchase and resale prices, marked the highest level in the United States since at least 2005.
The $68,843 profit on median priced single-family homes and condos represented a 34.7 percent return on investment compared to the original purchase price, up from 29.4 percent last year and 27.2 percent in 2018, to the highest average home-seller return on investment since 2006.
Both raw profits and ROI have improved nationwide for nine straight years. And last year's gain in ROI – up more than five percentage points – marked the largest annual increase since 2017. Profits shot up as the national median home price rose 12.8 percent in 2020 to $266,250 – a record high.
The combination of rising profits and record prices came during a year when the national housing market fended off damage that afflicted wide swaths of the U.S. economy after the Coronavirus pandemic of 2020 began spreading across the country in February. Unemployment rose to levels not seen since the Great Depression as millions of businesses temporarily or permanently closed or cut back. But a housing market boom that began in 2012 continued into its ninth year as a spate of buyers relatively unaffected financially by the pandemic – including a cluster looking to escape virus-prone urban areas - chased a declining supply of houses and pushed prices ever higher.
"Last year marked a unique year in the history of home prices and profits in the United States. A once-in-a-century health crisis tore through much of the nation's economy but seemed to have the opposite effect on the housing market," said Todd Teta, chief product officer at ATTOM Data Solutions. "Demand remained strong as people who could afford the space and relative safety of single-family homes did just that, aided by super-low mortgage rates and a strong stock market. But they went after a narrowing supply of housing stock, so prices soared and so did seller profits. While it's unclear how long that will last, in the annals of history, there will be few years recorded as better for sellers and more challenging for buyers."
Among 132 metropolitan statistical areas with a population greater than 200,000 and sufficient sales data, those in western states continued to reap the highest returns on investment, with concentrations on or near the West Coast. The top 10 metro areas with the highest ROIs on typical home sales were all in the West, led by in San Jose, CA (87.3 percent return on investments); Seattle, WA (72.1 percent); Salem, OR (69.6 percent); Spokane, WA (69.2 percent) and San Francisco, CA (68.2 percent).
Historical U.S. Home Seller Gains
Prices rise at least 10 percent in more than half the country as most markets hit new highs The U.S. median home price increased 12.8 percent in 2020, hitting an all-time annual high of $266,250. The annual home-price appreciation in 2020 outpaced the combined increases of 4.4 percent in 2019 and the 4.8 percent increase in 2018. The increase in 2020 topped all annual gains since at least 2006 in the United States.
Since the U.S. housing market began recovering in 2012 from the Great Recession of the late 2000s, the national median home price has risen 72.3 percent.
All 132 metropolitan statistical areas with a population of 200,000 or more and sufficient home price data saw median prices increase in 2020, while 69 saw prices spike at least 10 percent. Those with the biggest year-over-year increases in median home prices were Bridgeport, CT (up 21.4 percent); Myrtle Beach, SC (up 20.5 percent); Crestview-Fort Walton Beach, FL (up 19.6 percent); Boise, ID (up 18.7 percent) and Hilton Head, SC (up 18.3 percent).
The largest median-price increases in metro areas with a population of at least 1 million in 2020 came in Milwaukee, WI (up 15.3 percent); Memphis, TN (up 15.1 percent); Phoenix, AZ (up 14.9 percent); Birmingham, AL (up 13.7 percent) and Seattle, WA (up 12.9 percent).
Home prices in 2020 reached new peaks in 129 of the 132 metros (97 percent) analyzed, including New York, NY; Los Angeles, CA; Chicago, IL; Dallas, TX and Houston, TX.
The smallest gains among the 132 metro areas were in Worcester, MA (up 1.9 percent); Harrisburg, PA (up 2 percent); Pittsburgh, PA (up 3.3 percent); Boston, MA (up 3.5 percent) and Daphne-Fairhope, AL (up 4.1 percent).
Profit margins increase in more than 90 percent of nation. Profit margins on typical home sales rose in 121 of the 132 metro areas with sufficient data to analyze in 2020 (92 percent).
The largest annual increases in investment returns came in Mobile, AL (margin up 181.1 percent); Augusta, GA (up 112.8 percent); Huntsville, AL (up 84.4 percent); Davenport, IA (up 75.6 percent) and New Haven, CT (up 73.4 percent).
Among metro areas with a population of at least 1 million in 2020, the largest annual ROI increases were in Birmingham, AL (up 71.5 percent); Hartford, CT (up 56.9 percent); Cleveland, OH (up 52.2 percent); Rochester, NY (up 49.9 percent) and St. Louis, MO (up 45.7 percent).
The biggest annual decreases in investment returns in 2020 came in Honolulu, HI (down 11.8 percent); Greeley, CO (down 8.9 percent); Miami, FL (down 7.7 percent); Cape Coral, FL (down 7.4 percent) and San Francisco, CA (down 5.7 percent).
Aside from Miami and San Francisco, the only metro areas with a population of at least 1 million and declining profit margins in 2020 were Pittsburgh, PA (down 4.1 percent); Denver, CO (down 3.3 percent) and Dallas, TX (down 0.9 percent).
Homeownership tenure hits another record nationwide Homeowners who sold in the fourth quarter of 2020 had owned their homes an average of 8.33 years, up from 7.98 years in the previous quarter and 7.96 years in the fourth quarter of 2019. The latest figure represented the longest average home-seller tenure since at least the first quarter of 2000, the earliest period of available data. Tenures were up, year over year, in 73, or 68 percent, of the 107 metro areas with a population of at least 200,000 and sufficient historical data. As in the third quarter of 2020, the top tenures for home sellers in the fourth quarter of 2020 were all in Connecticut: Bridgeport, CT (13.15 years); Norwich, CT (12.98 years); Torrington, CT (12.83 years); New Haven, CT (12.47 years) and Hartford, CT (12.23 years). Average U.S. Homeownership Tenure
Counter to the national trend, 34 of the 107 metro areas (32 percent) posted a year-over-year decrease in average home-seller tenure, led by Madera, CA (down 10 percent); Champaign, IL (down 9 percent); Salem, OR (down 9 percent); Boston, MA (down 8 percent) and Cincinnati, OH (down 8 percent.
Cash sales at 13-year low in 2020
Nationwide, all-cash purchases accounted for 23.5 percent of single-family home and condo sales in 2020, the lowest level since 2007. The latest figure was down from 25.2 percent in 2019 and 27 percent in 2018, and was well off the 38.4 percent peaks in 2011 and 2012.
Among metropolitan statistical areas with a population of at least 200,000 and sufficient cash-sales data, those where cash sales represented the largest share of all transactions in 2020 were the same as in 2019: Macon, GA (48.7 percent of sales); Naples, FL (47.2 percent); Chico, CA (46 percent); Fort Smith, AR (43 percent) and Montgomery, AL (41.8 percent).
U.S. distressed sales share at 15-year low
Distressed home sales — including bank-owned (REO) sales, third-party foreclosure auction sales and short sales — accounted for 7.8 percent of all U.S. single-family home and condo sales in 2020, down from 11.1 percent in 2019 and 12.4 percent in 2018. The latest figure was less than one-quarter of the peak of 38.6 percent in 2011 and marked the lowest point since 2005.
States where distressed sales comprised the largest portion of total sales in 2020 were Connecticut (15.3 percent of sales), Rhode Island (14.7 percent), Delaware (13.8 percent), Illinois (12.6 percent) and Maryland (12.6 percent). Those with the lowest were Utah (2.1 percent), Maine (2.2 percent), Idaho (2.6 percent), Montana (3.2 percent) and Mississippi (3.5 percent).
Among 196 metropolitan statistical areas with a population of at least 200,000 and with sufficient data, those where distressed sales represented the largest portion of all sales in 2020 were Chico, CA (18 percent of sales); Atlantic City, NJ (17.6 percent); Peoria, IL (16.8 percent); New Haven, CT (16.2 percent) and Norwich, CT (16.2 percent).
Those with the smallest shares were Provo, UT (1.8 percent of sales); Salt Lake City, UT (1.9 percent); Ogden, UT (2.1 percent); Savannah, GA (2.3 percent) and San Jose, CA (2.9 percent).
Among 53 metropolitan statistical areas with a population of at least 1 million, those with the highest levels of distressed sales in 2020 were Hartford, CT (15.5 percent of sales); Providence, RI (14.9 percent); Baltimore, MD (13.9 percent); Cleveland, OH (13.5 percent) and Chicago, IL (12.2 percent).
Aside from San Jose and Salt Lake City, metro areas with at least 1 million people that had the lowest shares were Austin, TX (3.1 percent of sales); San Francisco, CA (3.6 percent) and Seattle, WA (3.8 percent).
U.S. Total Distressed Sales
Institutional investing at lowest level this century
Institutional investors nationwide accounted for 2.2 percent of all single-family home and condo sales in 2020 – the lowest level since at least 2000. The latest figure was down from 3.2 percent in 2019 and 3 percent in 2018.
Among metropolitan statistical areas with a population of at least 200,000 and sufficient institutional-investor sales data, those with the highest levels of institutional-investor transactions in 2020 were Memphis, TN (7 percent of sales); Atlanta, GA (6.8 percent); Laredo, TX (6.2 percent); Fort Wayne, IN (6.2 percent) and Montgomery, AL (6.1 percent).
Historical U.S. Home Sales By Type
FHA sales remain low as portion of all transactions Nationwide, buyers using Federal Housing Administration (FHA) loans accounted for 11.9 percent of all single-family home and condo purchases in 2020, down from 12 percent in 2019 but up from 10.6 percent in 2018. Still, the 2020 percentage marked the second-lowest annual level since 2008.
Among metropolitan statistical areas with a population of at least 200,000 and sufficient FHA-buyer data in 2020, those with the highest share of purchases made with FHA loans again were in Texas. They were led by McAllen, TX (31.5 percent of sales); El Paso, TX (26.6 percent); Beaumont, TX (26.6 percent); Amarillo, TX (24.9 percent); and Visalia, CA (24.7 percent).
Source: ATTOM Data Solutions
Tue, 02 February 2021 | housing
The housing market exceeded expectations in 2020, closing out the year with the highest annual home price gain since February 2014 in December at 9.2% according to the latest CoreLogic Home Price Index. Despite a blip in April, home-purchase demand surged as record-low mortgage rates persuaded first-time homebuyers to enter the market. Meanwhile, the consequences of the pandemic were seen in the dwindling supply of homes — dropping, on average, 24% below 2019 levels — as homeowners delayed selling.
These factors translated to significant home price growth in 2020, surpassing the previous year’s levels with an average monthly year-over-year gain of 5.7%, compared with 3.8% in 2019. However, with the severe shortage of for-sale homes, we may see rising affordability concerns and some prospective buyers priced out of the market in 2021.
Top Takeaways:
“At the start of the pandemic, many braced for a Great Recession-era collapse of the housing market,” said Frank Martell, president and CEO of CoreLogic. “However, market conditions leading into the crisis — namely low home supply, desire for more space and millennial demand — amplified the rapid acceleration of home prices.”
“Two record lows are fueling home price gains: for-sale inventory and mortgage rates,” said Dr. Frank Nothaft, chief economist at CoreLogic. “Prospective sellers with flexible timetables have opted to delay listing their home until the pandemic fades or they are vaccinated. We can expect more inventory to come available in the second half of the year, leading to slowing in price growth toward year-end.”
Source: CoreLogic
Wed, 03 February 2021 | housing economy
A new survey from realtor.com® found that more than two-thirds (68%) of shoppers were surprised by what they could actually afford for their first home. Forty-seven percent were surprised because their budget was larger than they thought, and 21% were surprised because it was less.
"The dramatic decline of mortgage rates in 2020 was a pleasant surprise for many buyers," said realtor.com® Senior Economist George Ratiu. "For first-time buyers, especially, the drop in the 30-year mortgage rate from 3.65 percent in March 2020 to a record-low of 2.65 percent in January has provided unexpected leverage. Lower rates allowed many buyers to stretch and buy more expensive homes while keeping their monthly budget the same."
To get what they wanted in their first home, many recent buyers had to compromise. Twenty-one percent had to expand their search into less expensive neighborhoods. Twenty percent had to go up in budget to get it all, and 18% had to eliminate some wish list features -- namely a garage, large backyard, finished basement, and pool -- to stay in budget.
Even with shortened wish lists or expanded budgets, nearly half (49%) of recent first-time homebuyers and more than a third (39%) of prospective first-time homebuyers said they fell in love with a home last year that they were outbid on or later learned they couldn't afford. It happened more than once too: 20% of recent first-time homebuyers were outbid on at least one home they wanted, and 20% made five or more offers before finally getting a home.
"You have to know what you can afford before you head too far down the homebuying road," said realtor.com® Home and Lifestyle Expert Lexie Holbert. "Putting pen to paper and getting a real sense of your current monthly expenses and what you're saving each month is a good place to start when thinking about your mortgage. Especially as a first timer, it's really important to stick to your budget when searching online so you don't fall in love with something you can't afford. Using the monthly mortgage payment filter on realtor.com® can help you be sure you're only looking at homes within your price range."
For the 44% of Americans who've been planning to buy but don't have enough for a down payment, their first home might be closer than they think. Half of recent first-time home buyers were able to save for a home in less than three years, mostly by setting aside a portion of their paycheck each month (50%), cutting out discretionary spending (33%), and saving lump sum money like tax refunds (32%). Plus, help from family could get you there: 52% of Americans who bought their first home in 2020 said they got help with their down payment from friends or family. The number one lender? Their parents.
For more details, see the full report at https://www.realtor.com/research/first-time-home-buyers-housing-2021.
Source: Realtor.com
Fri, 12 February 2021 | real estate pandemic
The COVID-19 pandemic continues to be a key factor in the real estate market, driving both prices and speed of sales according to a new report from Redfin, a read estate brokerage. In it's latest report covering the four-week period through February 7th, Redfin found that asking prices of newly listed homes hit a new all-time high of $334,770, up 10% from the same time a year ago, and pending home sales were up 29% year over year.
The pandemic real estate market is further compounded by a severe lack of inventory. New listings of homes for sale were down 11% from a year earlier, and active listings (the number of homes listed for sale at any point during the period) fell 37% from 2020 to a new all-time low. Half (52%) of homes that went under contract had an accepted offer within the first two weeks on the market, well above the 43% rate during the same period a year ago. This is the first time the four-week average has surpassed 50% since at least 2012 (as far back as Redfin's data for this measure goes). During the week ending February 7, the rate was 57%.
"There is a serious lack of new listings, and although prices are through the roof, homeowners are reluctant to sell, because it's so hard to buy again unless you are moving to a less expensive area where you can afford to outbid other buyers," said Redfin chief economist Daryl Fairweather. "Sellers who are concerned about finding their next home are asking buyers for a rent-back agreement, which allows the seller to stay in the home until they can move into their next one. Offering a rent-back agreement can also be a winning strategy for buyers with flexible timelines."
To view the full report, including charts and methodology, please visit: https://www.redfin.com/news/housing-market-update-over-half-of-homes-sold-in-2-weeks/
Source: Redfin
Wed, 17 February 2021 | real estate
Despite record low inventory, January home sales posted a 13.5% increase over a year ago. That followed four consecutive months of year-over-year sales increases of 19% to 22% on the heels of pandemic lockdowns.
January's year-over-year increase in homes sold represented a sizable gain from the year before and was in line with the pre-COVID months of December 2019 (13.5%) and January 2020 (10.5%).
"January home sales started the year off with a bang despite the current shortage of homes for sale," said Adam Contos, CEO of RE/MAX Holdings, Inc. "January's year-over-year sales increase wasn't as pronounced as what we saw in the back half of 2020, but it was solid by any objective measure – and it signals that 2021 could be an historically good year for housing. Uncommonly low interest rates, the ascent of the millennial homeowner and the prospect of working from anywhere are converging to shape a housing market unlike any other. We could see mortgage rates begin to inch up soon, so now might be an ideal time for homebuyers and sellers to make their move and take advantage of the favorable conditions."
Although the growth in sales moderated a bit, other key metrics showed the aftereffects of housing's 2020 record-setting, second-half recovery:
Highlights and the local markets leading various metrics for January 2021 include:
Closed Transactions
Of the 53 metro areas surveyed in January 2021, the overall average number of home sales is down 32.1% compared to December 2020, and up 13.5% compared to January 2020. Leading the year-over-year sales percentage increases were San Francisco, CA at +38.5%, Anchorage, AK at +31.7%, and Wilmington/Dover, DE at +30.9%.
Median Sales Price – Median of 53 metro median prices
In January 2021, the median of all 53 metro Median Sales Prices was $285,000, down 1.7% from December 2020, and up +11.8% from January 2020. No metro area saw a year-over-year decrease in Median Sales Price. Forty-five metro areas increased year-over-year by double-digit percentages, led by Boise, ID at +24.3%, Pittsburgh, PA at +21.3%, and Indianapolis, IN at +20.5%.
Days on Market – Average of 53 metro areas
The average Days on Market for homes sold in January 2021 was 40, up three days from the average in December 2020, and down 19 days from the average in January 2020. The metro areas with the lowest Days on Market were Omaha, NE at 18, Boise, ID at 19, and a two-way tie between Cincinnati, OH and Nashville, TN at 21. The highest Days on Market averages were in Des Moines, IA at 99, Miami, FL at 88, and Augusta, ME at 78. Days on Market is the number of days between when a home is first listed in an MLS and a sales contract is signed.
Months Supply of Inventory – Average of 53 metro areas
The number of homes for sale in January 2021 was down 12.1% from December 2020 and down 35.7% from January 2020. Based on the rate of home sales in January 2021, the Months Supply of Inventory decreased to 1.7 compared to 1.9 in December 2020, and decreased compared to 3.5 in January 2020. A six months supply indicates a market balanced equally between buyers and sellers. In January 2021, of the 53 metro areas surveyed, only one metro area, Indianapolis, IN at 9.8, reported a months supply at or over six, which is typically considered a buyer's market. The markets with the lowest Months Supply of Inventory were a two-way tie between Albuquerque, NM and Boise, ID at 0.5, and a four-way tie between Phoenix, AZ, Denver, CO, Seattle, WA, and Salt Lake City, UT at 0.6.
Source: ReMax
Thu, 18 March 2021 | real estate
ATTOM Data Solutions released its year-end 2020 U.S. Home Flipping Report, which shows that 241,630 single family homes and condos in the United States were flipped in 2020, down 13.1 percent from 2019 to the lowest point since 2016.
The number of homes flipped in 2020 represented 5.9 percent of all home sales in the nation during the year, down from 6.3 percent in 2019 to the same percentage seen in 2018. The declines in the number of homes flipped in 2020, as well as the portion of home sellers represented by investors, marked the first time since 2014 that both measures decreased annually.
While flipping activity declined, gross profits and profit margins shifted in opposite directions. Profits rose in 2020, but profit margins dipped - the third straight year that returns on investments declined.
Homes flipped in 2020 typically generated a gross profit of $66,300 nationwide (the difference between the median sales price and the median amount originally paid by investors). That was up 6.6 percent from $62,188 in 2019 to the highest point since at least 2005.
But the typical gross flipping profit of $66,300 translated into just a 40.5 percent return on investment compared to the original acquisition price. The latest ROI (before accounting for mortgage interest, property taxes, renovation expenses and other holding costs) was down from 41.5 percent in 2019 and from 46.4 percent in 2018. The 2020 ROI was off more than 10 percentage points from peaks over the past decade in 2016 and 2017. The 2020 figure also stood at the lowest point since 2011.
Historical U.S. Flipping Gross Profit & Returns Chart
Investors saw their profit margins dip again during a year when the median value of the homes they flipped rose more slowly than the median price they paid to purchase properties – 8.4 percent versus 9.1 percent. The decline in home-flipping profits marked a rare weak spot in the U.S. housing market, which otherwise boomed in 2020 despite economic damage caused by the worldwide Coronavirus pandemic.
"Last year was a banner year for the U.S. housing market, with the apparent exception of the home-flipping business, which saw its fortunes slide a bit more in 2020. Home flippers did still make a nice profit on investments that generally take around six months to turn around - just not as much as they did in the previous few years," said Todd Teta, chief product officer at ATTOM Data Solutions. "It's too early to know if that small slide was a sign of weakness in the broader housing market or just a bump in the road. We will know much more as we gauge other key market metrics in the coming months."
Home flipping rates down in 64 percent of local markets; biggest drops in South and West
Home flips as a portion of all home sales decreased from 2019 to 2020 in 126 of the 198 metropolitan statistical areas analyzed in the report (63.6 percent). Nine of the 10 biggest decreases in annual flipping rates among MSAs came in the South and West, led by San Antonio, TX (rate down 27.3 percent); Tuscaloosa, AL (down 25.7 percent); Santa Rosa, CA (down 24.8 percent); Brownsville, TX (down 24.1 percent) and Houston, TX (down 22 percent). Metro areas qualified for the report if they had a population of at least 200,000 and at least 100 home flips in 2020.
Aside from San Antonio and Houston, the biggest decreases in flipping rates in 2020 across MSAs with a population of 1 million or more were in Indianapolis, IN (rate down 19.3 percent); Las Vegas, NV (down 19 percent) and Austin, TX (down 18.4 percent).
Home flipping rates increased from 2019 to 2020 in 72 metro areas with sufficient data to analyze (36.4 percent). The largest annual increases in 2020 in the home flipping rate came in Norwich, CT (up 38.2 percent); Hartford, CT (up 31.1 percent); Boulder, CO (up 29 percent); Albuquerque, NM (up 26.9 percent) and Anchorage, AK (up 26.2 percent).
Aside from Hartford, the biggest annual flipping-rate increases in MSAs with a population of 1 million or more were in Providence, RI (rate up 8.6 percent); Tucson, AZ (up 8.4 percent); Memphis, TN (up 7.9 percent) and Jacksonville, FL (up 3.6 percent).
Home flips purchased with financing dip while those bought with cash tick upward
Nationally, the percentage of flipped homes purchased with financing dipped in 2020 to 41.7 percent, down from 42.3 percent in 2019 and from 41.8 percent two years ago. The annual decrease was the first since 2010.
Historical U.S. Home Flipping Financing Trends Chart
Meanwhile, 58.3 percent of homes flipped in 2020 were bought with all-cash, up from 57.7 percent in 2019 and from 58.2 percent in 2018.
Historical U.S. Home Flipping Acquisition Trends Chart
Among metropolitan statistical areas with a population of 1 million or more and sufficient data to analyze, those with the highest percentage of flips purchased with financing in 2020 included Tuscaloosa AL (80.4 percent); Lexington, KY (74.8 percent); Charlottesville, VA (72 percent); Syracuse, NY (67 percent) and Duluth, MN (66.7 percent).
Typical home flipping returns up in 2020 to highest level in at least 15 years
Homes flipped in 2020 were sold for a median price nationwide of $230,000, with a gross flipping profit of $66,300 above the median original purchase price paid by investors of $163,700. That national gross-profit figure was up from $62,188 in 2019 and from $64,000 in 2018 to the highest level since at least 2005.
2020 Gross Flipping ROI by Price Range Chart
Among the 53 markets in the U.S. with a population of 1 million or more, those with the largest gross-flipping profits in 2020 included San Jose, CA ($274,000); San Francisco, CA ($171,000); New York, NY ($152,000); Los Angeles, CA ($151,500) and San Diego, CA ($147,750).
The lowest gross-flipping profits among metro areas with a population of at least 1 million in 2020 included Raleigh, NC ($30,000); Houston, TX ($37,174); San Antonio, TX ($39,867); Las Vegas, NV ($45,600) and Charlotte, NC ($46,000).
But typical home flipping returns decline for third straight year
With median resale prices on home flips rising more slowly in 2020 than they were when investors were buying properties, the profit margin on the typical flip in the U.S. last year fell to 40.5 percent, from a 41.5 percent in 2019 and 46.4 percent in 2018. The typical 2020 ROI was off more than 10 percentage points from peaks during the past decade of 51 percent in 2016 and 2017.
Among metro areas with a population of 1 million or more, the biggest decreases in profit margins in 2020 were in Jacksonville, FL (ROI down from 52.2 percent in 2019 to 39.4 percent in 2020); Richmond, VA (down from 84.4 percent to 73.6 percent); Cleveland, OH (down from 108.2 percent to 98.5 percent); Birmingham, AL (down 65 percent to 58.6 percent) and Pittsburgh, PA (down from 133.8 percent to 128.1 percent).
In that same group of markets, the biggest increases in returns on investment on the typical sales were in Hartford, CT (ROI up from 70.4 percent in 2019 to 83.5 percent in 2020); Rochester, NY (up from 68.4 percent to 80.4 percent); Milwaukee, WI (up from 64.4 percent to 76.4 percent); Austin, TX (up from 12.4 percent to 23.5 percent) and Philadelphia, PA (up from 100 percent to 107.2 percent).
Among metro areas with a population of at least 1 million, the biggest profit margins in 2020 came in Pittsburgh, PA (128.1 percent); Philadelphia, PA (107.2 percent); Cleveland, OH (98.5 percent); Buffalo, NY (93.5 percent) and Virginia Beach, VA (89. 6 percent). The smallest were in Raleigh, NC (13.6 percent); Las Vegas, NV (19.5 percent); Houston, TX (20.2 percent); Denver, CO (20.4 percent) and Phoenix, AZ (20.8 percent).
Average time to flip nationwide increases to 181 days
Home flippers who sold homes in 2020 took an average of 181 days to complete the flips, up slightly from an average of 177 days for homes flipped in 2019 and 178 days in 2018.
Percent of flipped homes sold to FHA buyers increases for second straight year
Of the 241,630 U.S. homes flipped in 2020, 14 percent were sold to buyers using a loan backed by the Federal Housing Administration (FHA), up for the second consecutive year from 13.8 percent in 2019 and 12.6 percent in 2018.
Among the 198 metro areas with a population of at least 200,000 and at least 100 home flips in 2020, those with the highest percentage of 2020 home flips sold to FHA buyers — typically first-time homebuyers — were Beaumont, TX (32.7 percent); Stockton, CA (32.4 percent); El Paso, TX (30.1 percent); McAllen, TX (29.7 percent) and Visalia, CA (29.3 percent).
Thirty-one counties had a home flipping rate of at least 10 percent in 2020
Among 741 counties with at least 50 home flips in 2020, there were 31 counties where home flips accounted for at least 10 percent of all home sales last year. The top five were Macon County, TN (north of Nashville, TN) (14.3 percent); Lincoln County, MO (north of St. Louis, MO) (14 percent); Clayton County, GA (outside Atlanta, GA) (14 percent); Shelby County (Memphis), TN (13.8 percent) and Warren County, TN (east of Murfreesboro, TN) (13.7 percent).
Ten zip codes had a home flipping rate of at least 25 percent
Among 6,806 U.S. zip codes with a population of 5,000 or more and at least 10 home flips in 2020, there were 10 zip codes where flips accounted for at least 25 percent of all home sales last year, including five in Memphis, TN. They were led by 38116 in Shelby County (Memphis), TN (31.5 percent); 45207 in Hamilton County (Cincinnati), OH (29.8 percent); 38127 in Shelby County (Memphis), TN (28 percent); 38115 in Shelby County (Memphis), TN (27.8 percent) and 38128 in Shelby County (Memphis), TN (27.5 percent).
High-level takeaways from fourth-quarter 2020 data:
Report methodology
ATTOM Data Solutions analyzed sales deed data for this report. A single-family home or condo flip was any arms-length transaction that occurred in the quarter where a previous arms-length transaction on the same property had occurred within the last 12 months. The average gross flipping profit is the difference between the purchase price and the flipped price (not including rehab costs and other expenses incurred, which flipping veterans estimate typically run between 20 percent and 33 percent of the property's after repair value). Gross flipping return on investment was calculated by dividing the gross flipping profit by the first sale (purchase) price.
Source: ATTOM Data Solutions
Fri, 19 March 2021 | housing real estate
The median home sale price increased 17% year over year to $330,250—an all-time high—according to a new report from Redfin. This is the largest increase on record in this data set, which goes back through 2016.
Below are other key housing market takeaways for more than 400 U.S. metro areas during the 4-week period ending March 14.
"This time last year, the housing market was shutting down as many cities implemented strict shelter in place orders. A year later the pandemic is still with us, but the housing market is red-hot. It's so hot some buyers are acting irrationally," said Redfin Chief Economist Daryl Fairweather. "Some people are willing to do whatever it takes to win a bidding war to the point they may be overpaying. Still, I wouldn't call this a housing bubble because the demand for homes is truly there and the buyers can afford these high prices. Bubbles burst; I don't see that happening. The best hope buyers have is that home prices start to grow at a slower pace, but I don't expect prices to fall."
In the coming weeks, as the nation's housing market enters the period where comparisons to a year ago overlap with a steep decline in homebuying demand at the start of the pandemic, many housing demand measures will begin to show very large year-over-year increases. Redfin will provide context around those measures in its reporting as new data becomes available.
To view the full report, including charts and methodology, please visit: www.redfin.com/news/housing-market-update-one-year-pandemic/
SOURCE Redfin
Mon, 22 March 2021 | housing real estate
Homebuyers who offer all cash improve their chances of winning a bidding war by 290%, making it the most effective strategy to win a home in a competitive situation, according to a new report from Redfin (www.redfin.com). The report is based on an analysis of data on thousands of offers written by Redfin agents on behalf of their homebuying clients from July 2020 to February 2021.
Finding ways to make a buyer's offer more attractive is particularly important in today's hot housing market. Nationwide, 56% of Redfin offers faced bidding wars in January, the ninth consecutive month in which more than half of home offers written by Redfin agents faced competition.
Waiving the financing contingency is the second-most effective bidding-war strategy, improving homebuyers' odds of winning by 66%. Including an escalation clause, waiving the inspection contingency and conducting a pre-inspection (meaning the buyer conducted an inspection before making an offer) had no significant impact on whether a prospective buyer wins a bidding war, according to Redfin data.
Although the data shows that waiving the inspection contingency and including an escalation clause don't up buyers' chances of winning a bidding war, that's likely because those strategies are so common in a competitive market. Many buyers waive the inspection contingency and include an escalation clause when they know a home will receive multiple offers, so neither strategy ups one buyer's chances over that of a competitor.
Redfin agents report that well-priced single-family homes are receiving dozens of offers, and in some areas desirable homes are so competitive that they're selling for hundreds of thousands of dollars over asking price.
"Offering all cash is usually an effective bidding-war strategy, but the market is so hot that even the number-one strategy has evolved this year," said Orlando Redfin agent Nicole Dege. "All-cash buyers used to be able to go in a little below list price, but now I'm seeing a lot of cash offers that are at list price or higher. Anything below list price, regardless of the terms, just can't compete."
Most buyers don't have the option to offer all cash, so many agents work with buyers to come up with creative ways to make offers attractive.
"I do my best to help my buyers identify what the seller is most looking for in an offer and try to make that happen," said Rachel Wilson, a Redfin agent in Spokane, WA. "It's important for buyers to sweeten their offer in any way they realistically can. Sometimes that's more cash, sometimes it's waiving contingencies, but other times it's a matter of figuring out what the seller wants, like a fast close or a provision to allow the sellers to rent the home back for a few months."
To read the full report, including additional Redfin agent insights, please visit: https://www.redfin.com/news/most-effective-bidding-war-strategies-2020-2021.
Source: Redfin.com
Mon, 22 March 2021 | housing
Existing-home sales declined in February, following two prior months of gains, according to the National Association of Realtors®. Month-over-month, only one major region saw an increase in February, but all four U.S. regions recorded year-over-year gains.
Total existing-home sales completed transactions that include single-family homes, townhomes, condominiums and co-ops, decreased 6.6% from January to a seasonally-adjusted annual rate of 6.22 million in February. Sales in total climbed year-over-year, up 9.1% from a year ago (5.70 million in February 2020).
“Despite the drop in home sales for February – which I would attribute to historically-low inventory – the market is still outperforming pre-pandemic levels,” said Lawrence Yun, NAR’s chief economist.
He cautioned of a possible slow down in growth in the coming months as higher prices and rising mortgage rates will cut into home affordability.
“I still expect this year’s sales to be ahead of last year’s, and with more COVID-19 vaccinations being distributed and available to larger shares of the population, the nation is on the cusp of returning to a sense of normalcy,” Yun said. “Many Americans have been saving money and there’s a strong possibility that once the country fully reopens, those reserves will be unleashed on the economy.”
The median existing-home price for all housing types in February was $313,000, up 15.8% from February 2020 ($270,400), as prices rose in every region. February’s national price jump marks 108 straight months of year-over-year gains.
NAR’s 2021 Home Buyers and Sellers Generational Trends Report, released last week, highlights some of the effects of these price leaps, including buyers’ struggles with saving enough money for a down payment.
“Home affordability is weakening,” Yun said. “Various stimulus packages are expected and they will indeed help, but an increase in inventory is the best way to address surging home costs.”
According to Freddie Mac, the average commitment rate for a 30-year, conventional, fixed-rate mortgage was 2.81 in February, up from 2.74% in January. The average commitment rate across all of 2020 was 3.11%.
Total housing inventory3 at the end of February amounted to 1.03 million units, equal to January’s inventory and down 29.5% from one year ago (1.46 million). Unsold inventory sits at a 2.0-month supply at the current sales pace, slightly up from January’s 1.9-month supply and down from the 3.1-month amount recorded in February 2020. NAR first began tracking the single-family home supply in 1982.
Properties typically remained on the market for 20 days in February, down from both 21 days in January and from 36 days in February 2020. Seventy-four percent of the homes sold in February 2021 were on the market for less than a month.
First-time buyers were responsible for 31% of sales in February, down from 33% in January and from 32% in February 2020. NAR’s 2020 Profile of Home Buyers and Sellers released in late 2020 revealed that the annual share of first-time buyers was 31%.
Individual investors or second-home buyers, who account for many cash sales, purchased 17% of homes in February, up from 15% in January and equal to the percentage from February 2020. All-cash sales accounted for 22% of transactions in February, up from both 19% in January and from 20% in February 2020.
Distressed sales – foreclosures and short sales – represented less than 1% of sales in February, equal to January’s percentage but down from 2% in February 2020.
Single-family and Condo/Co-op Sales
Single-family home sales decreased to a seasonally-adjusted annual rate of 5.52 million in February, down 6.6% from 5.91 million in January, and up 8.0% from one year ago. The median existing single-family home price was $317,100 in February, up 16.2% from February 2020.
Existing condominium and co-op sales were recorded at a seasonally-adjusted annual rate of 700,000 units in February, down 6.7% from January and up 18.6% from one year ago. The median existing condo price was $280,500 in February, an increase of 12.3% from a year ago.
“This year, we’ve seen fair housing protections extended, recognized Realtors®’ remarkable volunteerism, and are collaborating with policymakers to increase revitalization endeavors in numerous neighborhoods,” said NAR President Charlie Oppler, a Realtor® from Franklin Lakes, N.J., and the CEO of Prominent Properties Sotheby’s International Realty. “We have made an incredible amount of notable progress thus far in 2021, and NAR is committed and encouraged to continue those efforts.”
Regional Breakdown
Compared to one year ago, median home prices increased in each of the four major regions.
February 2021 saw existing-home sales in the Northeast fall 11.5%, recording an annual rate of 770,000, a 13.2% increase from a year ago. The median price in the Northeast was $356,000, up 20.5% from February 2020.
Existing-home sales in the Midwest dropped 14.4% to an annual rate of 1,310,000 in February, a 2.3% rise from a year ago. The median price in the Midwest was $231,800, a 14.2% climb from February 2020.
Existing-home sales in the South decreased 6.1%, posting an annual rate of 2,770,000 in February, up 9.9% from the same time one year ago. The median price in the South was $271,200, a 13.6% increase from a year ago.
Existing-home sales in the West rose 4.6% from the month prior, recording an annual rate of 1,370,000 in February, a 12.3% jump from a year ago. The median price in the West was $493,300, up 20.6% from February 2020.
The National Association of Realtors® is America’s largest trade association, representing more than 1.4 million members involved in all aspects of the residential and commercial real estate industries.
Source: NAR
Wed, 24 March 2021 | housing real estate
With a red-hot real estate market coming out of the pandemic, many homebuyers are finding that they must tour more homes, cut bigger checks and waive more contingencies in order to win, according to a new report from Redfin. Remote work and low mortgage rates have prompted scores of Americans to buy homes during the pandemic, and this has resulted in a severe housing shortage that's fueling record-high prices, cutthroat competition, and putting sellers in the driver's seat.
Redfin's analysis reveals just how much homebuying has changed during the coronavirus pandemic.
Buyers Are Shelling Out Bigger Down Payments and Offering Above Asking In Order to Win
The median down payment on a home during the last six months was $40,987, up from $32,261 during the same period a year earlier. That's an increase of 27%, or nearly $9,000. The typical homebuyer made a down payment equal to 15.9% of the sale price, compared with 15.3% a year earlier. Down payments have mostly increased because housing prices have jumped.
"The surge in home prices actually hasn't resulted in higher monthly mortgage payments for most buyers because it has been offset by low mortgage rates, but it has driven up down-payment costs," said Redfin Chief Economist Daryl Fairweather. "This is likely putting homeownership out of reach for many cash-strapped first-time buyers who can't afford to put an additional $9,000 down."
In addition to spending more on down payments, homebuyers have been boosting their bids. During the last six months, 1 in 3 buyers (34.4%) paid more than the seller's original asking price, up from 1 in 5 buyers (21.2%) a year earlier.
"It's extremely competitive out there. One of my buyers recently beat out 25 other bids by offering $120,000 over the $425,000 asking price on a three-bedroom single-family home," said Portland Redfin real estate agent Mark Peterson. "There was a competing offer for the same amount, but my client won by opting for a shortened inspection period, accepting the home `as-is' and agreeing to pay up to $20,000 extra in the event that the appraisal came in low."
Buyers Are Waiving Contingencies At a Much Higher Rate Than Before the Pandemic
Over the last six months, 17.6% of successful offers submitted by Redfin agents waived the appraisal contingency, up from just 6.1% during the same period a year earlier. The share of successful offers waiving the inspection contingency jumped to 13.2% from 7.3%, and the portion waiving the financing contingency increased to 13.2% from 10.1%.
With more than half of home offers encountering bidding wars these days, buyers are finding that they need to sweeten their offers and get creative in order to win. Waiving these contingencies is a strategy buyers use to make their offers more competitive by assuring the seller that the deal will close without unforeseen headaches.
More Home Sales Are Being Financed With Conventional Loans
More than half (53%) of home sales in the last six months were paid for using conventional loans, or loans that are provided by private lenders and not backed by the federal government. That's up from 49.7% a year earlier. The portion of sales financed with jumbo loans, which are regularly used for purchases of higher-end homes, increased to 6% from 5.5%. Slightly more than a quarter (25.9%) of home purchases were paid for exclusively in cash, little changed from before the pandemic.
Meanwhile, the share of sales financed with Federal Housing Administration (FHA) loans fell to 9.9% from 12%, and the share of sales financed with Veterans Affairs (VA) loans dropped to 4.4% from 5.3%. FHA loans are backed by the U.S. government and are frequently used by first-time homebuyers and Americans who don't qualify for conventional loans due to lower credit scores. VA loans are used by military service members and veterans, and allow recipients to finance 100% of a home's cost without a big down payment.
"Lenders have been tightening up requirements for borrowers during the pandemic because so many families are at risk of defaulting on their mortgage payments," Fairweather said. "This means that many lower-income Americans have been unable to qualify for the loans they need to become homeowners and start building home equity. But as lenders become more confident in the economic recovery, they will be more willing to offer loans to borrowers with less-than-immaculate credit."
The Homebuying Process Is Taking Longer
Homebuyers toured 14 homes on average during the last six months, up from 13 homes a year earlier. From start to finish, the homebuying process took a median of 96 days, compared with 91 days during the same period the prior year. It's taking longer to find homes in part because there's an intensifying housing shortage that's causing many house hunters to get outbid repeatedly.
"Within hours of a home hitting the market, the showing schedule is often completely booked up," said Laurene Broccard, a Redfin real estate agent in Raleigh, NC. "We've seen properties get over 70 showings in three days and up to 30 offers. There are frequently buyers who want to see a home, but it goes under contract before they even have a chance to tour it."
To view the full report, including charts and methodology, please visit: https://www.redfin.com/news/profile-of-a-pandemic-homebuyer/
Source: Redfin
Wed, 24 March 2021 | pandemic housing
A new survey from Hippo, a home insurance company, finds a drastic shift in homeowner behavior during the pandemic. Hippo’s findings signal a new era of homeownership in which homeowners take on a more active role in investing in their homes, driven by an increased desire for added comfort and an inherent need to protect what has become most Americans’ largest financial asset. In the past year, twice as many homeowners spent $10,000 or more on their home than in the previous year. Even as pandemic-fueled social restrictions decline and people begin to return to work and school, 71% of homeowners said they will continue to invest in their home with the same level of interest in proactive improvements.
Hippo’s Survey Findings Include:
Homeowners are making more home improvements, upgrades and repairs
The pandemic has paved the way for increased investments made inside and outside of the home.
Homeowners still have dreaded to-do list tasks that are neglected
While home maintenance can be a tedious task, being proactive led to less repair work and strain on homeowners in the long run. Every dollar spent on maintenance can prevent up to $100 of repair costs.
Homeowners are becoming more proactive with their home care responsibilities
Americans are completing approximately 511 million home maintenance jobs each year. Nationally, homeowners are completing about 16 jobs per second.
Smart Home products continue to grow in popularity
In 2010, people owned 12.5 billion connected devices; by 2025, the number of connected devices is estimated to reach 50 billion. Increased comfort with Internet-enabled wireless devices, sleek design, and ease of use are increasing consumer adoption of smart home.
Millennials took the lead in upgrading and prioritizing their work-from-home setup, compared to other generations
With millennials being the largest generation in the U.S. labor force, the majority of remote workers are from this age group.
“The past year’s shift in how we live in our spaces has fundamentally changed the way we take care of our homes, with long-term effects,” said Rick McCathron, President of Hippo. “Our homes are no longer places where we spend minimal time —with our households becoming the primary haven where we work, socialize and rest, we’ve discovered that more people are becoming proactive in taking care of their homes. This increase in time at home is leading to a larger amount of home improvements, and at Hippo, we’re always underscoring the importance of maintaining your home while ensuring that homeowners are getting the best possible protection when home upgrades are made.”
Hippo is playing an active role in helping homeowners maintain their homes. Hippo customers have access to Hippo Home Care, a virtual home concierge service that provides proactive home care and maintenance services. Homeowners can receive annual remote home checkups by certified Home Pros that work with customers to guide them through an inspection of certain systems around the home. Hippo Home Care has delivered thousands of home checkups and its Home Pros have performed over 11,000 preventive actions. Hippo has the most widely adopted smart home program in the U.S. homeowners insurance sector,** providing homeowners with smart devices that equip them with the information to better protect their homes and access premium discounts on their home insurance policies.
Methodology
Survey insights were collected by Hippo among 1,000 homeowners in the U.S. ages 18-65+ through AYTM (Ask Your Target Market) from February 12-17, 2021.
*According to Statista 2020 U.S. household data https://www.statista.com/statistics/183635/number-of-households-in-the-us/#:~:text=How%20many%20households%20are%20in,households%20in%20the%20United%20States.
**Statement attributed to Matteo Carbone, founder of the IoT Insurance Observatory
Source: Hippo.com
Mon, 29 March 2021 | housing
More than three million renters said they were at risk of losing their homes with the federal eviction moratorium that set to expire on Wednesday, but a new Zillow analysis shows the number of households ultimately evicted could be as low as 130,000, depending on government action, the pace of economic recovery, and how landlords respond.
That range highlights the need for federal intervention -- both continuing the moratorium, which happened this morning, and additional assistance that will help not only struggling renters but also their landlords, such as the $45 billion in rental assistance in the recently passed federal stimulus bill.
“Job disruptions and economic hardships brought by the pandemic have hit renters particularly hard, and the number at risk for eviction is staggering. Although the path forward is uncertain, there are still ways for policymakers to keep the vast majority of renters in their homes,” said Chris Glynn, senior managing economist at Zillow. “We know two things for certain: the eviction moratorium is succeeding at keeping renters in their homes, and millions of renters believed that they will be evicted in coming months if the cliff came this week. How many actually are evicted depends on the economic recovery and individual landlord decisions.”
Forecasting the number of likely evictions
According to Zillow’s analysis of the Census Bureau's Household Pulse Survey, some 3.4 million Americans said they are at risk of eviction with the moratorium set to expire on Wednesday. With that extended three more months, as few as 130,000 renter households ultimately could be evicted, depending on the economic recovery, and individual landlord decision-making.
More than 8.3 million U.S. renters reported being behind on rent payments as of March 15, with 16.8% (1.41 million) of those respondents indicating they were ‘very likely’ to be evicted in the next two months[1]. While these numbers are sobering, it is expected that a small fraction of those fearing eviction will actually lose their homes -- not all landlords will choose to evict, and also, not all eviction filings result in actual eviction judgments in courts.
However, with no historical precedent for this potential crisis, predicting how small the fraction might be once the moratorium expires is extremely difficult, especially with remaining uncertainty around federal policies and how landlords are able to respond.
Landlords are facing difficult choices
Every tenant-landlord relationship is unique, but evictions based strictly on owed rent aren’t always in the landlord’s best interest. The process of evicting a tenant is time-consuming, and in the end, landlords might find themselves struggling for several months to fill vacant units, which will ultimately cost them even more.
“Landlords are willing to work with tenants, and when the moratoria ends we would much rather find a solution than evict," says Kellie Tollifson, owner and vice president of operations of T-Square Real Estate Services. "It's all about maintaining a relationship and open communication to figure out the best path for your unique situation. Landlords can direct tenants where to find assistance or work out payment plans that support both parties. Keeping people housed is the right thing to do, and it’s also good for business, so landlords are highly motivated to work with renters to get through the pandemic together.”
One mutually beneficial solution is offering a repayment plan and amortizing the back rent into ongoing rent payments, with landlords effectively serving as private creditors as they recover back rent over time. In this scenario, the benefit to the renter is avoiding an eviction, and the landlord is made financially whole. However, that might not be feasible for landlords who need a steady cash flow to make mortgage payments and remain afloat.
Last year, many young adults left their rentals to move back home, and one-third of rental listings were offering concessions this past fall as landlords tried to entice renters with benefits such as free parking or one-month free rent. And now with millions of U.S. renters at risk of eviction this summer coupled with increased rent growth across the U.S., finding new tenants without a record of evictions and with liquid funds to make security deposits may prove extremely challenging.
An eviction crisis could be avoided with the right federal support
While today’s extension protects renters from eviction, the policy should be coupled with relief for landlords and rental assistance programs to support both and avoid an eviction crisis on the horizon.
The recent federal stimulus bill was an invaluable lifeline in delivering direct economic relief, providing $45 billion in rental assistance to put money in the pockets of the most vulnerable renters, as well as landlords who have struggled to meet mortgage and utility obligations due to missed rent payments. However, the government has struggled to distribute that money fast enough to meet the needs of renters and landlords, as the March 31 moratorium deadline loomed.
“The ongoing challenge for policymakers is to keep renters in their homes without overburdening landlords,” according to Glynn. “Further extending the eviction moratorium achieves one goal but also prolongs the financial stress on individual landlords. Eventually the federal moratorium will end, back rents will come due, and landlords will be able to evict. Avoiding an eviction crisis will require that landlords, tenants, financial institutions, and policymakers work together to find constructive and creative ways to keep renters in their homes and make landlords financially whole. The alternative is millions of evictions, and the social and economic costs of that are unimaginable.”
The extended moratorium is a temporary bandage that has potentially damaging repercussions in the future, if not paired with other relief programs. Robust economic recovery and expedited distribution of fiscal support to renters and landlords is needed to prevent a potential eviction crisis, and keep landlords and renters in their homes.
Source: Zillow.com
Tue, 30 March 2021 | housing
With the pandemic shift to 'everything from home', the home has taken on more importance for American homeowners, Unison's 2021 "State of the American Homeowner" survey found. Homeowners are using their homes as offices, gyms, schools, shopping and much more. As a result, nearly ⅔ (64%) of respondents say living through the pandemic has made their home more important to them now than ever before.
According to the research, which surveyed 2,000 homeowners in the United States, homeownership brings positive feelings, with 91% of homeowners saying they feel secure, stable or successful owning a home. Seven in 10 (70%) homeowners feel emotionally attached to the homes that have kept them safe over the past year with 51% calling it a "key part of their life" — a significant increase compared to before the pandemic when 58% of homeowners had an emotional attachment to their home.
Despite financial instability caused by the pandemic, nine in 10 (90%) of American homeowners consider their home a financial asset (vs. a burden) — exactly the same percentage who said so before the pandemic. However, home finances are still a stressor for many homeowners, especially for younger homeowners and those navigating mortgage forbearance:
"The COVID pandemic has made my house more important (essential) in my life than before," one respondent said. Another said, "The pandemic has made me appreciate my home more."
With the additional roles the home has taken on over the past year, many homeowners are interested in making changes to their homes to support their expanding use.
"The American Dream of homeownership has taken on increased importance as the home has become the center of our daily lives, bringing our work, shopping, schools and gyms into where we live," said Unison CEO Thomas Sponholtz. "Many renters left their city apartments for larger houses in the suburbs, and many homeowners took on renovations, making their home more suitable to their expanding needs. As many have endured exceptional life and economic uncertainty and managed new or changing needs for their homes, it has never been a more important time to re-evaluate your investments as well as how you finance your home and life. This absolutely includes having a smarter way to tap into your home equity without debt in order to best adapt to your changing life situation and plans."
Many of those working from home during the pandemic, took action to make their homes (and Zoom calls) more comfortable: nearly a third (29%) of WFH homeowners converted a spare room into an office, and an equal number furnished their homes with office equipment or furniture; 23% upgraded internet or cellular service.
Millennials are more likely than older generations to have an emotional connection to their home, and they're also more likely to put their future saving and retirement plans at risk to keep it. Over three quarters (78%) of millennials feel emotionally attached to their home (vs 70% Gen X and 69% Boomer) about the same amount (77%) who say living through a pandemic has made their home more important to them now than ever. Over half of millennial homeowners (53%) say they used to view their home as a burden, but now view it as one of the most important things in their lives. But their finances are less established, and for those navigating mortgage forbearance, they're more likely to be borrowing against their future savings.
Many retired homeowners have paid off their homes and are funding their retirement with social security or a pension, giving them a sense of financial security, and homeowners planning for retirement are following the same model. Seven in ten (70%) retired homeowners' homes are fully paid off and nearly half (47%) say owning a home makes them feel secure - that it's a big financial asset. But the Fed is showing retirees' wealth in their home decreasing as they age and rock-bottom interest rates are putting pension funds and recipients at significant risk down the line - meaning this sense of security might be superficial.
Source: Unison
Thu, 01 April 2021 | housing real estate
Finding a home is only getting more difficult for this spring's home buyers who in addition to having more than 50% fewer homes to choose from are facing the double whammy of record-breaking prices and rising interest rates, according to the realtor.com® Monthly Housing Trends Report released today. And while more choices and slowing price growth may come to those who wait, mortgage rates will likely continue to creep up.
"In many areas of the country, there are half as many available homes for sale than a year ago -- and in some markets that number increases to less than one-third. For a buyer, that means if they had 10 homes in their price range to choose from last year, they have less than five, perhaps as few as three, available to them today," said realtor.com® Chief Economist, Danielle Hale. "As a result, home prices have skyrocketed, shattering previous records. We expect to see more sellers emerge in the weeks ahead, which should give buyers more options. Homes will likely continue to sell fast, but increasing interest rates and monthly costs could slow the pace of price gains, unless we see a boost in demand from equity-rich repeat buyers."
In March, the median national home listing price grew to $370,000, up 15.6% over last year and a new all-time high, according to realtor.com® records, which date back to 2012. Listing prices in the 50 largest metros grew by an average of 12.1% year-over-year with some markets seeing listing prices grow by nearly triple that amount. Topping the list was Austin where listing prices were up 39.8%, followed by Buffalo, N.Y. (+28.3%) and Los Angeles (+24.8%).
For a buyer putting 20% down, the monthly cost (principal and interest) of the typical March listing financed with a fixed-rate loan over 30 years was $1,260 as a result of rising home prices and rising interest rates, which averaged 3.08% in the month, according to Freddie Mac. Comparatively, the monthly cost was $1,160 in February and $1,140 in March 2020. Put another way, a buyer hoping to keep that $1,140 monthly payment would need to find a home priced at roughly $335,000 -- nearly $35,000 or 10% below the typical home on the market this March.
Nationally, the number of homes for sale in March decreased by 52% compared to last year, a steeper decline than February's 48.6% drop. This amounted to 534,000 fewer homes for sale compared to March 2020. Austin topped the list of inventory declines, down 72.7% from a year ago followed by Jacksonville, Fla. (-70.7%), and Raleigh, N.C. (-70.3%).
Although the trend of sellers putting their home on the market improved slightly from February, 20.0% fewer homes were listed for sale in March than a year ago. Overall, newly listed homes in the largest 50 metros decreased by 17.9% compared to last year. Only San Jose, Calif., (+48.1%), San Francisco (+39.1%), Los Angeles (19.7%), and New York (6.9%) saw an increase in the number of new listings in March.
In the final week of March -- which overlapped the initial housing market activity drop after the onset of the COVID-19 pandemic -- newly listed homes increased by 6.3% on a year-over-year basis. Despite the increase, newly listed homes ended March down 20%. Compared to a more typical non-pandemic year, March saw 117,000 fewer new sellers, adding to the more than 200,000 new listings deficit over the previous two months relative to the 2017 to 2019 average for the same time period.
Rising interest rates have yet to deter buyers, or perhaps, they are pushing them to act quickly. Either way, the typical home spent 54 days on the market in March, six days less than last year. Homes are selling even faster in the 50 largest U.S. metros, spending an average of 39 days on market.
Buffalo, N.Y., saw the greatest decline in days on market, with homes selling in just 29 days on average, 30 days faster than last year. Homes also are selling fast in Riverside, Calif., and Austin, Texas, where they are spending 23 and 26 days on market on average, respectively.
Source: Realtor.com
Thu, 01 April 2021 | housing real estate
Median home prices of single-family homes and condos in the first quarter of this year were more affordable than historical averages in 52 percent of counties with enough data to analyze. That was down from 63 percent of counties in the first quarter of 2020 and 95 percent during the same period five years ago. But rising wages and falling mortgage rates still compensated for near-20 percent spikes in home prices over the past year, helping to keep median home prices affordable for average wage earners around the country.
The report determined affordability for average wage earners by calculating the amount of income needed to meet monthly home ownership expenses — including mortgage, property taxes and insurance — on a median-priced home, assuming an 80 percent down payment and a 28 percent maximum "front-end" debt-to-income ratio. That required income was then compared to annualized average weekly wage data from the Bureau of Labor Statistics (see full methodology below). The 80-percent down payment criterion marks an update to ATTOM's affordability analysis, which now shows smaller portions of income needed to afford home ownership than recent reports.
Compared to historical levels, median home prices in 287 of the 552 counties analyzed in the first quarter of 2021 were more affordable than past averages. That was down from 349 of the same group of counties in the first quarter of 2020, a trend that came during a 12-month period when the national median home price shot up 18 percent, to $278,000, in the first quarter of 2021.
Yet, with workplace pay rising and home mortgage rates continuing to hit historic lows, major expenses on a median-priced home nationwide still consumed just 23.7 percent of the average wage across the country in the first quarter of 2021. That figure was up from 22 percent in first quarter of 2020 and from 19.7 percent five years ago. But it remained well within the 28 percent standard lenders prefer for how much homeowners should spend on those major expenses.
Those mixed trends – homes remaining affordable but not quite as much as they have historically – happened amid a surge over the past year of home buyers who largely escaped the economic damage caused by the recent worldwide Coronavirus pandemic. As those home seekers pursued a dwindling supply of homes for sale, prices shot up – just not enough to significantly outweigh the benefits of increased wages and average mortgage rates that sat below 3 percent.
"The past year certainly has been an odd one for the U.S. housing market. Home prices surged at a remarkable pace even as the virus pandemic damaged the U.S. economy, which dropped historical affordability levels. But average workers untarnished by the pandemic were still able to afford the typical home because wages and rock-bottom interest rates worked to their favor in a big way," said Todd Teta, chief product officer with ATTOM Data Solutions. "Much remains uncertain about the housing market in 2021. A lot will depend on how well the broader U.S. economy recovers from the pandemic and whether there are still many more buyers looking to escape congested neighborhoods most prone to the virus, pushing prices even higher. But for now, our data shows that average workers are able to manage the costs associated with rising values."
Among the 552 counties in the report, 327 (59 percent) had major home-ownership expenses on typical homes in the first quarter of 2021 that were affordable for average local wage earners, based on the 28-percent guideline. The largest of those counties were Cook County (Chicago), IL; Harris County (Houston), TX; Dallas County, TX; Bexar County (San Antonio), TX, and Wayne County (Detroit), MI.
The most populous of the 225 counties where major expenses on median-priced homes were unaffordable for average local earners in the first quarter of 2021 (41 percent of the counties analyzed) were Los Angeles County, CA; Maricopa County (Phoenix), AZ; San Diego County, CA; Orange County, (outside Los Angeles), CA and Miami-Dade County, FL.
Home prices up at least 10 percent in two-thirds of country
Median home prices in the first quarter of 2021 were up by at least 10 percent from the first quarter of 2020 in 360, or 65 percent, of the 552 counties included in the report. Counties were included if they had a population of at least 100,000 and at least 50 single-family home and condo sales in the first quarter of 2021.
Among the 42 counties with a population of at least 1 million, the biggest year-over-year gains in median prices during the first quarter of 2021 were in Wayne County (Detroit), MI (up 24 percent); Suffolk County, NY (outside New York City) (up 20 percent); Bronx County, NY (up 19 percent); Maricopa County (Phoenix), AZ (up 19 percent) and Harris County (Houston), TX (up 18 percent).
Counties with a population of at least 1 million that had the smallest year-over-year increases (or price declines) in the first quarter of 2021 were New York County (Manhattan), NY (down 2 percent); Santa Clara County (San Jose), CA (up 7 percent); Hennepin County (Minneapolis), MN (up 7 percent); Kings County (Brooklyn), NY (up 8 percent) and Orange County, CA (outside Los Angeles) (up 8 percent).
Price appreciation up more than wage growth in almost 90 percent of markets
Home price appreciation outpaced average weekly wage growth in the first quarter of 2021 in 474 of the 552 counties analyzed in the report (86 percent), with the largest counties including Los Angeles County, CA; Cook County (Chicago), IL; Harris County (Houston), TX; Maricopa County (Phoenix), AZ and San Diego County, CA.
Average annualized wage growth outpaced home price appreciation in the first quarter of 2021 in only 78 of the 552 counties in the report (14 percent), including Santa Clara County (San Jose), CA; New York County (Manhattan), NY; Honolulu County, HI; San Francisco County, CA and Suffolk County (Boston), MA.
Less than 28 percent of wages needed to buy a home in six of every 10 markets
Major ownership costs on median-priced homes in the first quarter of 2021 consumed less than 28 percent of average local wages in 327 of the 552 counties analyzed in this report (59 percent).
Counties requiring the smallest percent were Schuylkill County, PA (outside Allentown) (6.3 percent of annualized weekly wages needed to buy a home); Bibb County (Macon), GA (8.3 percent); Fayette County, PA (outside Pittsburgh) (8.4 percent); Macon County (Decatur), IL (9.9 percent) and Robeson County, NC (outside Fayetteville) (10.6 percent).
Among the 42 counties in the report with a population of at least 1 million, those where home ownership typically consumed less than 28 percent of average local wages in the first quarter of 2021 included Wayne County (Detroit), MI (12.2 percent); Philadelphia County, PA (14.1 percent); Cuyahoga County (Cleveland), OH (14.4 percent); Fulton County (Atlanta), GA (19.4 percent) and Franklin County (Columbus), OH (19.5 percent).
A total of 225 counties in the report (41 percent) required more than 28 percent of annualized local weekly wages to afford a typical home in the first quarter of 2021. Those counties that required the greatest percentage of wages were Kings County (Brooklyn), NY (75.7 percent of annualized weekly wages needed to buy a home); Marin County, CA (outside San Francisco) (75.5 percent); Santa Cruz County, CA (69.9 percent); Monterey County, CA, (outside San Francisco) (68.1 percent) and Maui County, HI (65.9 percent).
Aside from Kings County, NY, counties with a population of at least 1 million where home ownership consumed more than 28 percent of average annualized local wages in the first quarter included Orange County, CA (outside Los Angeles) (57.7 percent); Queens County, NY (56.3 percent); Nassau County, NY (outside New York City) (53.5 percent) and Alameda County (Oakland), CA (51.6 percent).
Average wages needed to afford median-priced home exceed $75,000 in less than 15 percent of markets
Annual wages of more than $75,000 were needed in the first quarter of 2021 to afford the typical home in just 75, or 14 percent, of the 552 markets in the report.
The highest annual wages required to afford the typical home were in New York County (Manhattan), NY ($247,802); San Mateo County (outside San Francisco), CA ($230,848); Marin County (outside San Francisco), CA ($218,830); San Francisco County, CA ($212,892) and Santa Clara County (San Jose), CA ($207,691).
The lowest annual wages required to afford a median-priced home in the first quarter of 2021 were in Schuylkill County, PA (outside Allentown) ($10,089); Fayette County, PA (outside Pittsburgh) ($12,957); Bibb County (Macon), GA ($13,708); Robeson County, NC (outside Fayetteville) ($14,133) and Cambria County, PA (east of Pittsburgh) ($16,251).
Slight majority of housing markets more affordable than historic averages
Among the 552 counties analyzed in the report, 287 (52 percent) were more affordable in the first quarter of 2021 than their historic affordability averages, down from 63 percent of the same group of counties that were more affordable historically in the first quarter of 2020.
Counties with a population of at least 1 million that were more affordable than their historic averages (indexes of more 100 are considered more affordable compared to historic averages) included New York County (Manhattan), NY (index of 128); Montgomery County, MD (outside Washington, D.C.) (121); Cook County (Chicago), IL (114); King County (Seattle), WA (110) and Santa Clara County (San Jose), CA (108).
Counties with the best affordability indexes in the first quarter of 2021 included Schuylkill County, PA (outside Allentown) (index of 195); Macon County (Decatur), IL (188); Fayette County, PA (outside Pittsburgh) (171); Calcasieu Parish (Lake Charles), LA (149) and Bibb County (Macon), GA (146).
Among counties with a population of at least 1 million, those where the affordability indexes improved the most from the first quarter of 2020 to the first quarter of 2021 were New York County (Manhattan), NY (index up 14 percent); Santa Clara County (San Jose), CA (up 7 percent); Orange County, CA (outside Los Angeles) (up 3 percent); Kings County (Brooklyn), NY (up 3 percent) and Hennepin County (Minneapolis), MN (up 2 percent).
Slightly fewer than half of markets less affordable than historic averages
Among the 552 counties in the report, 265 (48 percent) were less affordable than their historic affordability averages in the first quarter of 2021, up from 37 percent in the first quarter of last year.
Counties with a population greater than 1 million that were less affordable than their historic averages (indexes of less than 100 are considered less affordable compared to their historic averages) included Wayne County (Detroit), MI (index of 78); Dallas County, TX (81); Tarrant County (Fort Worth), TX (82); Harris County (Houston), TX (83) and Maricopa County (Phoenix), AZ (86).
Counties with the worst affordability indexes in the first quarter of 2021 were Canyon County, ID (outside Boise) (index of 67); Grayson County, TX (outside Dallas) (72); Ada County (Boise), ID (74); St. Louis City/County, MO (75) and Bonneville County (Idaho Falls), ID (76).
Counties with a population of least 1 million residents where affordability indexes decreased the most from the first quarter of 2020 to the same period in 2021 included Wayne County (Detroit), MI (index down 11 percent); Harris County (Houston), TX (down 11 percent); Dallas County, TX (down 8 percent); Bronx County (down 8 percent) and Oakland County, MI (outside Detroit) (down 8 percent).
Report Methodology
The ATTOM Data Solutions U.S. Home Affordability Index analyzes median home prices derived from publicly recorded sales deed data collected by ATTOM Data Solutions and average wage data from the U.S. Bureau of Labor Statistics in 552 U.S. counties with a combined population of 245.7 million. The affordability index is based on the percentage of average wages needed to pay for major expenses on a median-priced home with a 30-year fixed rate mortgage and an 80 percent down payment. Those expenses include property taxes, home insurance, mortgage payments and mortgage insurance. Average 30-year fixed interest rates from the Freddie Mac Primary Mortgage Market Survey were used to calculate the monthly house payments.
The report determined affordability for average wage earners by calculating the amount of income needed for major home ownership expenses on a median-priced home, assuming a loan of 20 percent of the purchase price and a 28 percent maximum "front-end" debt-to-income ratio. For example, the nationwide median home price of $278,000 in the first quarter of 2021 required an annual wage of $52,523, based on a $222,400 loan and monthly expenses not exceeding the 28 percent barrier — meaning households would not be spending more than 28 percent of their income on mortgage payments, property taxes and insurance. That required income was less than the $61,984 average wage nationwide based on the most recent average weekly wage data available from the Bureau of Labor Statistics, making a median-priced home nationwide unaffordable for average workers.
Source: ATTOM Data Solutions
Wed, 07 April 2021 | pandemic housing
After a year in which "working from home" began to feel like "living at work," America has undergone a profound shift in its understanding of "home," driving homeowners to want more space, new uses and a better environment to nurture positive changes that evolved during lockdown. They also want to address design, condition and space frustrations they felt while spending uninterrupted time indoors.
According to the 8th annual LightStream Home Improvement Trends Survey,1 nearly half (47%) of U.S. homeowners say they are utilizing their space differently since the onset of the pandemic. And more than two-thirds (69%) say spending more time at home has made them eager to upgrade.
The LightStream survey reports that 91% of respondents say a lack of space in their home became a big frustration during the COVID-19 experience. Younger homeowners in particular say they wish they had more room (63% of Gen Z vs. 71% of Millennials vs. 64% of Gen X vs. 47% of Boomers). As a result, 12% of those with home improvement plans for 2021 are including a home addition while 14% are planning a basement or attic remodel. As spaces are being reimagined, the most popular projects homeowners plan to spend money on in 2021 include kitchen remodels (38%), outdoor improvements (35%), bathrooms remodels (32%) and home repair/technology upgrades (30%).
There are many reasons why space utilization has become so important. The LightStream survey uncovered that more than one-in-ten (12%) U.S. homeowners say the number of children or adults in their home has increased during the pandemic due to COVID-19 safety (35%), health reasons (20%) or other changes. As a result, over half (56%) of those newly-expanded households have renovation plans for 2021. Not surprisingly, three-in-four (72%) homeowners whose households have grown wish they had more personal space. Multi-generational families (that may include parents, children and their grandparents) and traditional households (parents and their children) are more likely to undertake 2021 projects than homeowners without children (44% of each vs. 34%), particularly to improve at-home working and learning spaces.
Source: Truist
Wed, 07 April 2021 | housing
The latest Fannie Mae Home Purchase Sentiment Index® (HPSI) reveals home buyers are still eager to buy despite a sellers' market. The HPSI increased in March by 5.2 points to 81.7. Four of the HPSI's six components increased month over month, including the components related to homebuying and home-selling conditions, household income, and home prices. The mortgage rate outlook component experienced the only decline; and the latest results indicate that only 6% of consumers believe that mortgage rates will decrease over the next 12 months. Year over year, the HPSI is up 0.9 points.
"The significant increase in the HPSI in March reflects consumer optimism toward the housing market and larger economy as vaccinations continue to roll out, a third round of stimulus checks was distributed, and the spring homebuying season began – perhaps with even more intensity this year, since 2020's spring homebuying season was limited by virus-related lockdowns," said Doug Duncan, Fannie Mae Senior Vice President and Chief Economist. "Home-selling sentiment experienced positive momentum across most consumer segments – nearly reaching pre-pandemic levels and generally indicative of a strong seller's market. Consumers once again cited high home prices and tight inventory as primary reasons why it's a good time to sell. Alternatively, while the net 'good time to buy' component increased month over month, it has not recovered to pre-pandemic levels, as the homebuying experience continues to prove difficult for many of the same reasons, namely high prices and a lack of supply."
Source: Fannie Mae
Thu, 08 April 2021 | pandemic housing
The number of buyers who locked in mortgage rates for second homes shot up a record 128% year over year in March, according to a new report from Redfin. That marks the 10th straight month of 80%-plus annual growth. The year-over-year increase should be taken in context because demand for second homes was relatively weak in March 2020, when the coronavirus pandemic first hit the U.S. and real estate activity in many parts of the country temporarily halted with lockdowns.
The data in the report is based on a Redfin analysis of mortgage-rate lock data from real estate analytics firm Optimal Blue.
Pandemic-driven demand for second homes is soaring as many affluent remote workers opt to spend at least part of their time in vacation destinations, even as some companies are planning for workers to return to the office. The annual rise in demand for second homes is nearly quadruple the 34% year-over-year gain for primary homes.
"The Palm Springs housing market is incredibly busy, with an influx of vacation-home buyers from Los Angeles and San Francisco," said local Redfin agent Nisa Sheikh. "Many of them are tech workers who can do their jobs remotely, and they enjoy the weather and lifestyle here in the desert. People don't want to vacation in a hotel room right now, and many of my buyers are planning to turn their second homes into Airbnb rentals and earn some extra income when they're not in town."
The surging interest in vacation homes is indicative of the uneven financial recovery taking place throughout the U.S. Wealthy Americans are likely to have held onto their jobs—many with the freedom to work remotely—and they're earning money through a robust stock market and rising real-estate values. But people in lower income brackets are more likely to work in industries like restaurants, retail and hospitality that are still far from recovered.
"This recession has driven wealthy and low-income Americans further and further apart, and the soaring demand for vacation homes during the pandemic is a perfect example of their unequal financial footing, with some people buying second homes and others unable to buy their first," said Redfin Chief Economist Daryl Fairweather. "Home prices just keep going up. That's a good thing for Americans who already own one home because they can take advantage of their increased equity to buy other assets, which in some cases includes another home. But it's bad for lower- and middle-class families, particularly those who are renters, because the barrier to homeownership is getting higher and higher."
Home prices in seasonal towns are up 19% year over year
Home prices in seasonal towns, where second homes are often located, are up more than prices in non-seasonal towns. The median sale price for homes in seasonal towns rose 19% year over year in February—the most recent month for which data is available—to $417,000. That's the eighth straight month of 10%-plus year-over-year growth.
For homes in non-seasonal towns, the median sale price rose 16% to $370,000. For this analysis, a seasonal town is defined as an area where more than 30% of housing is used for seasonal or recreational purposes.
While home prices are up significantly almost everywhere in the country, the fact that they're up more in seasonal towns is an indication that out-of-towners and second-home buyers are impacting those markets, pushing prices up for locals.
To read the full report, including charts, please visit: https://www.redfin.com/news/second-home-demand-record-high.
Source: Redfin
Thu, 08 April 2021 | pandemic workplace
A new workplace study form Hibob shows a majority of U.S. workers' job satisfaction is back to pre-pandemic levels. With ongoing remote work, the allowance of flexible work schedules, the ability to be autonomously productive, and time saved without a commute are contributing and shaping the next normal where a hybrid working model leads the way. The study also showed that with strong job satisfaction while remote, the rollout of the vaccine will not prompt employees to run back to the office five days a week. Some even say an obligation to return to a physical workspace would push them to look for a new job.
"There's been so much emphasis on the vaccine and a 'return to normalcy' that is supposed to restore happiness and business as usual. Many companies are failing to see the tremendous benefit that working from home has provided its people - flexibility, work/life balance, adjusted hours, and more time with family. Employees have established a strong rhythm with this structure, and it's going to be really hard to shock people back into the workplace 5 days a week just because they are vaccinated," says Hibob CEO Ronni Zehavi. "Not only has the virtual workplace changed, but the physical workplace will be taking on a new form as we ease back into socializing with others. We should not take a step backwards but instead, companies must create flexible, hybrid workplaces to keep their employees happy and engaged."
Job Satisfaction Is Tied to Flexible Work Models
Hibob's study found that job satisfaction is back up to pre-pandemic levels as people have adjusted to the benefits of working from home.
Additionally, data reveals parents and working females preferred working from home at higher rates, as it allows for more time with family and flexibility with childcare.
With a shift towards hybrid work, the office purpose has also changed -- it's evolving from an everyday work space to a place designated for socialization, collaboration, and company culture. Companies implementing hybrid models may use in-office time more for meetings, get-togethers, and onboarding, and less for individual work and clocking in and out. However, how it's viewed now differs for employees based on their roles.
Why Vaccines Might Not Be The Workplace Panacea
Data proves that flexibility is key to employee success. Even with vaccines helping mitigate safety concerns, they are not a reason for pushing fully in-person work 5 days a week given the proven success of hybrid.
Vaccination expectations and protocol are going to be difficult to streamline and implement in a way that appeals to all employees Everyone has a different view on what should and shouldn't be allowed, and it's clear that a mandate won't placate employee concerns and offer the best solution for work/life balance and job satisfaction.
"Hibob's study proves again what we've already known - flexibility leads to productivity and employee happiness. While it may have taken a few months to adjust, the past year has shown that a combination of in-person and remote work has a broad appeal to employees of all job levels, genders, and parental standings. Companies need to realize that the next normal is here, and make sure their policies put people first and help them perform at their best," adds Zehavi.
The national survey was conducted online by Pollfish on behalf of Hibob on February 25, 2020. It includes responses from 1,000 full-time employees ages 25 and up in the United States.
Source: Hibob
Tue, 20 April 2021 | housing real estate
Sales of luxury homes in the U.S. rose 41.6% year over year in the first quarter of 2021, far outpacing sales growth in every other segment of the housing market, according to a new report from Redfin that divided all U.S. residential properties into five price tiers—luxury, expensive, mid-priced, affordable and most affordable—based on Redfin Estimates of the homes' market values. By comparison, sales of affordable homes increased 7% and sales of mid-priced homes climbed 5.9%.
Sales growth has historically been similar across price tiers, but has diverged as the coronavirus pandemic has exacerbated economic inequality. Affluent Americans with the flexibility to work from anywhere are taking advantage of low mortgage rates and buying up high-end houses—particularly in popular vacation destinations—which is contributing to the surge in luxury-home sales. Meanwhile, many lower-income Americans have lost their jobs and lack the means to become homeowners. The 49 most populous U.S. metropolitan areas all experienced growth in sales of luxury homes during the first quarter. The biggest gainer was Miami, where luxury-home sales skyrocketed 101.1% from a year earlier. It was followed by San Jose, CA (92.3%), Oakland, CA (82%), Sacramento, CA (79.3%) and Las Vegas (72.7%). Miami, Sacramento and Las Vegas have consistently made Redfin's ranking of top migration destinations during the pandemic. "Luxury properties, even those in the $3 million range, are getting multiple offers and going for well over the asking prices," said Oakland, CA Redfin real estate agent Katy Polvorosa. "That's something we haven't seen before, even though the Bay Area has many affluent residents. Everyone just wants more space and big backyards, whether it's because they're stuck at home during the pandemic or because they have a growing family." The U.S. housing market is experiencing a record deficit of homes for sale as demand soars due to low mortgage rates and remote work, but the shortage is less extreme in the luxury price tier, which is allowing high-end home sales to flourish. The number of luxury homes for sale fell 5.1% year over year in the first quarter, the smallest decline of all five price tiers. By comparison, the supply of affordable homes for sale slumped 14.9%, and the supply of mid-priced homes plummeted 19.8%. The supply shortage in the luxury market is less severe than the supply shortage in other price tiers partly because more high-end homeowners are putting their properties up for sale. New listings of luxury homes grew 15.8% year over year in the first quarter, while listings in most other price tiers declined. "With a huge shortage of affordable homes for sale, many non-luxury homeowners are hesitant to put their properties on the market because they're worried they'll have trouble finding their next house," said Redfin Chief Economist Daryl Fairweather "This isn't as big of an issue for luxury homeowners since there's a relative abundance of high-end homes to choose from." Non-luxury homeowners have also taken advantage of mortgage forbearance during the pandemic, allowing them to hold onto their homes in the event of a default instead of putting them up for sale. This is another reason the housing shortage is more acute in the non-luxury market, Fairweather added. The typical luxury home that was for sale during the first quarter spent 61 days on the market—38 fewer days than the same period in 2020. That compares with 26 fewer days for expensive homes, 18 fewer days for mid-priced homes and 14 fewer days for affordable homes. Source: RedfinFri, 23 April 2021 | housing
New data in Zillow's® Monthly Market Report1 suggests the inventory crunch bedeviling home searchers may be starting to turn around as record appreciation of home values makes it more enticing to sell. Meanwhile, the recovery of rents is gaining broad momentum and touching double-digit annual gains in hot markets like Phoenix and Riverside.
Although continued demand for homes pushed total for-sale inventory down 1.1% in March, the monthly decline was the smallest seen since July. That's thanks to a rush of new inventory (rising 30% from late February to late March), which signals sellers are following the traditional pattern of listing their homes in spring.
"March often sees a boost in inventory, and the return to some seasonal norms is a positive sign that supply is beginning to catch up with demand," said Zillow economist Treh Manhertz. "With home values skyrocketing, vaccination rates rising and employees getting long-term guidance on where they can work, we expect an increasing number of homeowners to join the market and list in the coming months. That will come as welcome news to home shoppers who are seeing bidding wars and homes plucked from the market weeks faster than usual."
Home value appreciation pushed the accelerator closer to the floor in March, rising a record 1.2% month over month to $276,717. This is the largest monthly rise in Zillow records going back to 1996 and a roughly $3,200 jump in value from February to March for the typical home. Annual appreciation rose to 10.6%, the largest jump in 15 years.
Zillow economists forecast 6.4 million homes to sell in 2021 -- up 13.5% from 2020 and the strongest year for sales since 2006 -- and expect home values to rise 10.4% over the next 12 months.
Although the rapid ascent of home values have stoked fears of another housing bubble, strong fundamentals underpin the market's heat. Average credit scores among buyers are much higher than in the early 2000s, lending standards are tighter, and demand going forward -- including from a wave of millennials aging into homebuying -- is expected to keep sales strong in the coming months.
The fastest monthly home value growth was seen in Austin (2.4%), Phoenix (2.3%) and Riverside (1.9%), all accelerating from the previous month. Growth is slowest in San Jose (0.05%), San Francisco (0.6%) and Orlando (0.7%). Annual appreciation as of March ranged from blistering highs of 20.2% in Phoenix to lows of 5.4% in San Francisco, which is still higher than historical averages.
Rents nationally took a dramatic step upward in March, beginning to make up ground after a slump that began this time last year. Zillow's Observed Rent Index (ZORI) rose to $1,721, up 0.9% over February -- the largest monthly increase since 2014. This especially strong showing is the third consecutive monthly increase, bringing annual growth back above 1% for the first time since July.
Rents have been softer since the beginning of the pandemic in many large markets and fell in the priciest ones -- though Zillow research shows those savings were limited to the most expensive zip codes. In March, rents rose at an accelerated rate almost across the board, though the highest year-over-year growth is taking place in the Inland West and Sun Belt, along with some more affordable metros in the Midwest and Rust Belt.
Among the largest 50 U.S. metros, annual rent growth is highest in Riverside (12.2%), Phoenix (10.5%), and Providence (9.9%). Rents remain the lowest year-over-year in New York (-9.0%), San Francisco (-8.3%), San Jose (-7.4%), Boston (-5.2%) and Seattle (-5.0%). But all have improved at least a full percentage point since February, showing lost activity may be returning.
Source: Zillow
Tue, 27 April 2021 | housing real estate
Prices of urban single-family homes are rising nearly 20% year over year—faster than any other type of home—according to a new report from Redfin. But this year's hot housing market doesn't discriminate: Urban condo sales are up nearly 30% year over year, more than any other home type.
Key takeaways from Redfin's analysis, which looks at the housing market divided into five categories (urban single-family homes, suburban single-family homes, rural single-family homes, urban condos, suburban condos) during the 12 weeks ending April 4 include:
Urban single-family homes are currently seeing the fastest price growth partly because they offer the best of both worlds for many buyers, especially with the end of the pandemic in sight.
"Now that Americans have had a year to consider what the pandemic and its aftermath mean for their lifestyles, we're seeing a lasting preference for single-family homes—but rural and suburban settings are no longer as popular as they were at the start of the pandemic," said Redfin economist Taylor Marr. "Many homebuyers are still prioritizing features that were desirable at the beginning of the pandemic, like space for a home office or a big backyard, partly because many people plan to continue working from home. But as people venture out of their homes more often, they're rediscovering the advantages of living in a city. People want to continue barbecuing in the backyard, but they also want the option of turning off the grill and walking to their local pizza place."
The median sale price of single-family homes in urban neighborhoods is up 19.4% year over year to $286,000—the biggest increase on record, and a bigger price gain than any other category of home.
The fact that prices are growing faster for single-family homes than for condos in all types of neighborhoods indicates that many buyers in the pandemic era have a strong preference for self-contained homes without shared walls. Price growth for rural single-family homes outpaced all other home types from the beginning of the pandemic through the end of 2020, when price growth for urban single-family homes surpassed its rural counterpart.
Pageviews of homes in large metros are on the upswing, signaling a return to the city
Redfin.com pageviews of homes in metro areas with a population of more than 1 million—which include both urban and suburban neighborhoods—increased 62% year over year in March. That's a bigger increase than the 30% gain for small towns and the 18% increase for rural areas. The fact that homebuyer interest in large metros is accelerating while it's decelerating in rural areas and small towns suggests the pandemic-driven bump in demand for rural properties has peaked and buyers are returning to the city.
The year-over-year jump in pageviews for large metros is likely exaggerated because March marks one year since the pandemic hit the U.S. Last March, views of homes in that type of area dropped significantly as cities went under lockdown and buyers turned toward smaller towns.
Single-family homes are selling faster than condos
Another indicator of the hot single-family housing market is that single-family homes in all neighborhood types are selling faster than condos, and selling significantly faster than they were a year ago. The typical suburban single-family home spent 25 days on the market before going under contract during the 12 weeks ending April 4. Urban single-family homes are selling nearly as fast, with a median of 29 days on the market before going under contract.
Homes in all categories are selling significantly faster than they were a year ago, led by rural single-family homes, which are selling 32 days faster than last year. The increased speed for rural properties is reflective of the pandemic-driven surge in demand for spacious homes outside city centers: In the beginning of 2020, pre-pandemic, homes in rural areas sat on the market longer because fewer buyers were interested in living in far-flung areas with long commutes to the office.
Condos are picking up in popularity from a pandemic-driven plunge, even with the outsized popularity of single-family homes
Condo sales are picking up more than sales of single-family homes. The number of urban condos sold was up 29.9% year over year during the 12 weeks ending April 4, the biggest gain on record and a bigger increase than any other home category. It's followed by suburban condos (22.8%).
The uptick in condo sales is a sign that the condo market is recovering after plummeting with the onset of the pandemic. During the 12 weeks ending June 29, 2020, sales of urban condos reached a record low, down 44.9% year over year. Sales of suburban condos dipped nearly as much, dropping 42.3%.
Source: Redfin
Tue, 27 April 2021 | economy housing
U.S. home prices continued to increase at a blistering pace through February, jumping 12 percent on an annual basis. The S&P CoreLogic Case-Shiller U.S. National Home Price NSA Index, covering all nine U.S. census divisions, reported a 12.0% annual gain in February, up from 11.2% in the previous month. The 10-City Composite annual increase came in at 11.7%, up from 10.9% in the previous month. The 20-City Composite posted an 11.9% year-over-year gain, up from 11.1% in the previous month.
Phoenix, San Diego, and Seattle reported the highest year-over-year gains among the 20 cities in February. Phoenix led the way with a 17.4% year-over-year price increase, followed by San Diego with a 17.0% increase and Seattle with a 15.4% increase. Nineteen of the 20 cities reported higher price increases in the year ending February 2021 versus the year ending January 2021.
MONTH-OVER-MONTH
Before seasonal adjustment, the U.S. National Index posted an 1.1% month-over-month increase, while the 10-City and 20-City Composites both posted increases of 1.1% and 1.2% respectively in February.
After seasonal adjustment, the U.S. National Index posted a month-over-month increase of 1.1%, and the 10-City and 20-City Composites both posted increases of 1.1% and 1.2% respectively as well. In February, all 20 cities reported increases before and after seasonal adjustments.
ANALYSIS
"Strong home price gains continued in February 2021," says Craig J. Lazzara, Managing Director and Global Head of Index Investment Strategy at S&P DJI. The National Composite Index marked its ninth month of accelerating prices with a 12.0% gain from year-ago levels, up from 11.2% in January. This acceleration is also reflected in the 10- and 20-City Composites (up 11.7% and 11.9%, respectively). The market's strength continues to be broadly-based: all 20 cities rose, and 19 cities gained more in the 12 months ended in February than they had gained in the 12 months ended in January.
"More than 30 years of S&P CoreLogic Case-Shiller data help us to put February's results into historical context. The National Composite's 12.0% gain is the highest recorded since February 2006, exactly 15 years ago, and lies comfortably in the top decile of historical performance. Housing's strength is reflected across all 20 cities; February's price gains in every city are above that city's median level, and rank in the top quartile of all reports in 18 cities.
"These data remain consistent with the hypothesis that COVID has encouraged potential buyers to move from urban apartments to suburban homes. This demand may represent buyers who accelerated purchases that would have happened anyway over the next several years. Alternatively, there may have been a secular change in preferences, leading to a permanent shift in the demand curve for housing. Future data will be required to analyze this question.
"Phoenix's 17.4% increase led all cities for the 21st consecutive month, with San Diego (+17.0%) and Seattle (+15.4%) close behind. Although prices were strongest in the West (+13.0%) and Southwest (+12.9%), every region logged double-digit gains."
Source: S&P CoreLogic Case-Shiller
Fri, 30 April 2021 | housing real estate
The median home-sale price increased 20% year over year to $347,500—an all-time high—according to a new report from Redfin. This number is somewhat inflated due to a slight dip in median sale prices around this time in 2020, and due to fewer high-end homes being sold at this time a year ago, and more high-end homes being sold now.
Below are other key housing market takeaways for more than 400 U.S. metro areas during the 4-week period ending April 25 (unless otherwise noted).
Note that at this time last year, pandemic stay-at-home orders halted homebuying and selling, which makes year-over-year comparisons unreliable for select housing metrics. As such, Redfin has broken this analysis into two sections: metrics that are acceptable to compare to the same period in 2020, and metrics for which it makes more sense to compare to the same period in 2019.
Metrics to compare to 2020:
Metrics to compare to 2019:
Mortgage purchase applications decreased 5% week over week (seasonally adjusted). For the week ending April 29, 30-year mortgage rates increased slightly to 2.98%.
"I am concerned about how we as a society are going to reckon with just how expensive housing has become," said Redfin Chief Economist Daryl Fairweather. "But I'm not worried about a housing crash because these sky-high prices are supported by the new reality of well-funded buyers who are often benefiting from newfound mobility via remote work. As the economy recovers, we have the opportunity to reimagine our country's role in supporting a healthy housing market. For instance, we can subsidize construction of affordable homes or support first-time homebuyers in underserved communities. We have our work cut out for us when it comes to ensuring homeownership is attainable for middle-class Americans with good jobs and money saved up, not just for the wealthiest among us."
To view the full report, including charts and methodology, please visit: https://www.redfin.com/news/housing-market-update-home-prices-up-20-pct/
Source: Redfin
Mon, 10 May 2021 | real estate
The number of buyers who locked in mortgage rates for second homes soared 178% year over year in April, marking the 11th straight month of 80%-plus growth, per a new report from Redfin. The record increase should be taken in context: It is likely exaggerated because demand for second homes dropped 24% year over year last April, the month after the coronavirus pandemic hit the U.S. and real estate activity in the country nearly ground to a halt. Still, second-home mortgage rate locks are holding steady at more than double pre-pandemic levels.
The rise in demand for second homes is more than twice the increase for primary homes, with the number of buyers who locked in mortgage rates for primary homes rising 78% year over year in April. That's a record jump, too, but should also be taken in context, as demand for primary homes dropped last April due to the pandemic.
The data in Redfin's report is based on the company's analysis of mortgage-rate lock data from real estate analytics firm Optimal Blue. Demand for vacation homes remains elevated as wealthy Americans continue to have the freedom to work remotely and earn money from robust stock portfolios and rising home values. Even as some offices start to reopen, many Americans plan to work remotely for the long term, at least part of the time.
"The combination of the wealthy becoming wealthier, remote work turning into the new normal and low mortgage rates is creating an ideal environment for affluent Americans to buy vacation homes," said Redfin Chief Economist Daryl Fairweather. "As long as the economy continues to grow, I don't foresee demand for second homes slowing down anytime soon."
The elevated demand for second homes in the pandemic era is one sign of economic inequality in the U.S., with some buyers able to afford second homes and others unable to become homeowners at all.
Home prices are up 27% year over year in seasonal towns
Home prices in seasonal towns, where second homes are often located, rose 27% year over year in April to $450,000. Prices in non-seasonal towns are up by a similar margin: 28% to $419,000. Though those jumps are both the biggest on record, the increases are somewhat inflated because price growth was slow at this time last year due to stay-home orders and economic lockdowns related to the pandemic. Non-seasonal price growth is slightly bigger than seasonal price growth this month partly because prices in non-seasonal towns dropped more significantly at this time last year.
Price growth for homes in seasonal towns started recovering last summer, and April marks the 10th straight month of 10%-plus year-over-year growth.
To read the full report, including charts with metro-level data, please visit: https://www.redfin.com/news/second-home-demand-doubles
Source: Redfin
Tue, 11 May 2021 | housing real estate
Redfin forecasts a record $2.53 trillion worth of home sales in America in 2021—a 17% year-over-year gain that would mark the largest annual increase in percentage terms since 2013. Redfin made the prediction in a new report out today. To put $2.53 trillion into perspective, it's roughly equal to the value of Amazon.com Inc. and Facebook Inc. combined, or the 2020 gross domestic product (GDP) of France.
The U.S. housing market has undergone a meteoric rise during the coronavirus pandemic, fueled by record-low mortgage rates and a wave of migration made possible by remote work. Almost two-thirds (60%) of people expect to continue working from home at least part time after the pandemic, according to an April survey of Redfin.com visitors who have moved to a different metro area in the last year. These factors—alongside an acute housing shortage—helped March become the hottest month in housing history, with home values, price growth and selling speed all hitting new heights.
In short, the combination of rising demand (home sales) and surging home prices is fueling the increase. While home prices could grow more slowly if mortgage rates rise, that would result in a more balanced housing market, which could actually lead to more home sales, according to Redfin Chief Economist Daryl Fairweather.
"We expect 2021 to be an even more active year for the housing market than 2020 because homebuyers have a better sense of what the future looks like," said Fairweather. "Employers are providing clarity on permanent remote-work policies, the economy is recovering and mortgage rates remain low. All of these factors mean that we'll likely see even more buyers enter the market this year and in 2022."
The South is expected to lead the way with $1.09 trillion of home sales forecast for 2021, followed by the West with $696.3 billion, the Midwest with $422.6 billion and the Northeast with $322.8 billion.
The South has consistently held the top spot, but has inched further ahead in recent years. This is likely because it has more vacant land on which to build, and has attracted scores of out-of-town homebuyers who are in search of affordability and space, Fairweather said. Seven of the 10 U.S. metros with the biggest net inflows in the first quarter were in the South. Net inflow is a measure of how many more Redfin.com home searchers looked to move into a metro than leave.
"A lot of wealth from the coasts is shifting South," said Fairweather. "Affluent homebuyers from New York and San Francisco have moved to places like Florida and Texas during the pandemic, which has fueled home sales and driven up prices in those areas."
To read the full report, including additional charts and graphs, please visit:
https://www.redfin.com/news/record-home-sales-forecast-2021
Wed, 19 May 2021 | real estate
U.S. home purchases by investors rose 2.7% year over year in the first quarter, marking the first period of growth since the coronavirus pandemic began, according to a new report from Redfin. That follows three consecutive quarters of declines, during which investor purchases slumped by as much as 45.5%.
Redfin defines an investor as any institution or business that purchases residential real estate.
Investors bought about 1 of every 7 U.S. homes (14.9%) in the first quarter—a rebound from the prior three quarters, during which they bought closer to 1 in 10 homes. Investor market share is now just shy of the 16.1% level it hit in the first quarter of 2020, when the pandemic had barely begun.
"Investors are likely starting to feel more comfortable because the economy is in recovery mode," Redfin Senior Economist Sheharyar Bokhari said. "They also may be jumping back in because they see the intensifying shortage of homes for sale as an opportunity. With so few houses on the market, many families are resorting to rentals. Flush with cash, investors are able to snap up the homes that are available, and then turn around and rent them out to folks who can't find a home or are priced out of homeownership. This is likely making the housing shortage even worse, and also means that individual homeowners sometimes end up competing with investors in bidding wars."
A frothy stock market is another factor that could attract more investors to real estate, according to Redfin Chief Economist Daryl Fairweather.
"Investors may shift away from stocks and toward housing because housing is a relatively safe bet," Fairweather said. "There aren't a lot of safe bets out there right now."
Investors initially pumped the brakes at the beginning of the pandemic because the housing market had ground to a halt. The market then came roaring back, but investors were slower to rejoin the party, likely due to lingering economic uncertainty. Many investors purchase homes with the intention of renting them out, so when rents plunged, unemployment skyrocketed and evictions were halted due to the pandemic, some opted for a cautious approach.
Single-Family Homes See Biggest Gain in Investor Purchases
Investor purchases of single-family homes rose 4.8% year over year in the first quarter, outpacing growth in every other property type. By comparison, investor purchases rose just 0.9% for condos, and fell a respective 3.6% and 11.6% for townhomes and multifamily properties.
This is likely because Americans have been prioritizing space and privacy during the pandemic, turning single-family homes into a hotter commodity than crowded apartment buildings in the city.
While investors have been buying more single-family homes during the pandemic, they still have the biggest market share in the multifamily sector. They bought a quarter (25.8%) of multifamily properties that sold in the U.S. during the first quarter. By comparison, they purchased 14.8% of both single-family homes and condos, and 12.5% of townhomes.
High-Priced Properties See Largest Jump in Investor Purchases
Investor purchases of high-priced homes jumped 19.8% year over year in the first quarter. By comparison, investor purchases of mid-priced homes rose 12.7% and investor purchases of low-priced homes declined 9.2%.
The market for high-end homes has flourished during the pandemic, in part because affluent Americans—with extra cash from a strong stock market and a year of being stuck at home—have been relocating to vacation destinations to enjoy the sun and work remotely. Demand for second homes, which are often high-priced properties, has more than doubled.
The housing shortage also isn't as severe in the high-priced segment of the market, which may be another factor allowing investor purchases in that tier to outperform, Bokhari said.
While investors have been snapping up high-priced homes during the pandemic, they still have the largest market share in the low-priced-home segment—a trend that has held constant for decades. In the first quarter, 1 of every 5 low-priced homes that sold in the U.S. (20.8%) was purchased by an investor. That compares with 12.5% of high-priced homes and 11.3% of mid-priced homes.
Source: Redfin
Tue, 01 June 2021 | housing real estate
A record high of 51% of homes sold for more than their list price—up from 26% the same period a year earlier—according to a new report from Redfin .
Below are other key housing market takeaways for more than 400 U.S. metro areas during the 4-week period ending May 23, unless otherwise noted.
Note that at this time last year, pandemic stay-at-home orders halted homebuying and selling, which makes year-over-year comparisons unreliable for select housing metrics. As such, Redfin has broken this report into two sections: metrics that are OK to compare to the same period in 2020, and metrics for which it makes more sense to compare to the same period in 2019.
Metrics to compare to 2020:
The share of homes sold in one or two weeks are both just shy of their record high level, which was set during the four-week period ending May 9.
Metrics to compare to 2019:
For the week ending May 21, Mortgage purchase applications increased 2% week over week (seasonally adjusted). For the week ending May 27, 30-year mortgage rates fell slightly to 2.95%.
"We are seeing a typical late-spring slowdown in new listings and pending sales," said Redfin Chief Economist Daryl Fairweather. "However, prices don't typically peak until late August, and their growth remains completely unhinged. The fact that homes keep selling for more and more above asking prices goes to show that many more people want a home than there are homes for sale. I don't see that changing until mortgage rates increase, which will likely happen later this year. But until then, the housing market will remain red-hot."
Source: Redfin
Tue, 01 June 2021 | retail spending
Think everyone was staying home, doing all their shopping online and avoiding human contact at all costs during the past year? Think again. According to the J.D. Power 2021 U.S. Home Improvement Retailer Satisfaction Study,℠ released today, home improvement is one retail category that maintained a consistent level of in-store shopping.
“The home improvement category is booming right now as part of the pandemic-related silver lining from people being home more and finally getting the time to tackle those home projects,” said Christina Cooley, director of the home intelligence practice at J.D. Power. “What’s interesting is that unlike many other retail categories, when it comes to home improvement, customers are heading out to the stores to touch and feel products before buying—and wanting to engage with store staff along the way.”
Following are some key findings of the 2021 study:
Study Ranking
Ace Hardware ranks highest in customer satisfaction among home improvement retailers for the 14th time in 15 years, with a score of 863. Menards (836) ranks second.
The 2021 U.S. Home Improvement Retailer Satisfaction Study measures customer satisfaction with home improvement retailers by examining five factors (in alphabetical order): in-store experience; merchandise; online experience; price; and staff and service. The study is based on responses from 2,172 customers who purchased home improvement-related products from a home improvement retailer within the previous 12 months. The study was fielded in January-February 2021.
Source: JD Power
Wed, 09 June 2021 | consumers digital pandemic
In March 2020, households became the center of daily American life — and connectivity took on newfound importance. With work, school, medical visits, fitness and retail shopping all crowding under one roof, rapidly shifting needs drove sudden demand for an evolving suite of connected devices and digital services. The second edition of "Deloitte's Connectivity & Mobile Trends 2021 Survey," an online survey of 2,009 U.S. consumers conducted in March 2021, saw households beginning to push the limits of connectivity. More consumers upgraded their home broadband, added Wi-Fi extenders, and expanded their mobile data plans. While connectivity providers and device makers quickly rallied to keep the nation connected and productive, many consumers were overwhelmed with managing a wide range of devices, services and communications suddenly necessary for life at home.
Networks, services, devices and institutions rallied to effectively support the shift to working and schooling from home. Some had connectivity and technology issues but for many, human factors posed more of a challenge.
According to Paul Silverglate, vice chairman, Deloitte LLP and U.S. technology sector leader,"The onset of the COVID-19 pandemic was like a time machine that suddenly propelled us tens of years into the future. It has changed how we interact with our connected devices, ultimately helping consumers, health care providers, education professionals, technology innovators and others adapt, innovate and thrive in our daily lives. Our survey showed that the underlying technology for these new behaviors was truly tested and, for the most part, held up under increased connectivity demands. As well as we have adapted, we hit the limits of what our current technology can deliver. We are excited to see how faster connections, better devices, and new apps change how we live, work and play in the future."
Recent growth in inexpensive and easy videoconferencing helped medical organizations overcome distance challenges to deliver much needed virtual house calls during the pandemic. The pandemic's urgency also suspended some of the regulatory barriers that made it difficult for providers to connect virtually with patients. This was good news for consumers who felt virtual doctor visits helped them continue to receive care during the pandemic, while minimizing risk of exposure to themselves and to other patients.
Does this mean healthier innovation?
Success with virtual doctor visits may bode well for future health care innovation. As wearables advance to record more discrete health, fitness and wellness data, their ability to support health care providers will likely grow, along with many users' desire to share more of this data with their providers.
According to Jana Arbanas, vice chairman, Deloitte LLP and U.S. telecom, media and entertainment sector leader, "The pandemic was a giant beta test of behaviors that broke down barriers, removed distance and prioritized health and wellness. Our survey revealed that people are willing to adopt new products and services even while adjusting to challenging circumstances in trying times. This adaption and need for inventive technology are placing more pressure on companies to innovate even faster. As we've seen throughout the pandemic, this innovation should focus around the essential elements of daily life to help people thrive in their crowded homes — underscoring the simple fact that technology and invention, ideally, is about supporting human needs."
Both in and out of the home, smartphones helped people get on with their lives while mitigating pandemic risks. Users adopted a range of new digital behaviors, including online mobile payment services, contactless store payments and shopping and buying online from local providers who offer home delivery or curbside pickup. These mobile solutions were available prior to COVID-19, but the pandemic further highlighted their value.
The survey also revealed that while connectivity held up remarkably well to the demands of unexpectedly crowded homes during the pandemic, many households had reached the limits of broadband, wireless and Wi-Fi networks. And with reduced movement outside the home during the pandemic, it's not yet clear how well existing smartphones and mobile connectivity will serve post-pandemic behaviors.
Source: Deloitte, Connectivity and Mobile Trends Survey
Thu, 10 June 2021 | housing interest rates
The number of buyers who locked in mortgage rates to purchase a second home nationwide rose 48% year over year in May, according to a new report from Redfin (redfin.com), the technology-powered real estate brokerage. Though that's a significant increase, it's the first time in a year the annual growth rate has fallen below 80%. Year-over-year increases are likely exaggerated because demand for second homes was relatively low in May 2020 due to the coronavirus pandemic slowing real estate activity.
Demand for vacation homes jumped in June 2020 as the U.S. real estate market came roaring back to life, with a 110% year-over-year increase in second-home mortgage locks, and the level remained elevated through April. The annual increase in May is similar to pre-pandemic levels.
There are several reasons for the cooling in second-home demand this spring. High prices are likely playing a role, as is the reopening of offices. The typical spring slowdown in overall pending home sales is also impacting vacation-home sales. Plus, many people with the desire and means to buy a vacation home this year have already done so throughout the pandemic.
Additionally, mortgage-lending rules for second homes tightened in April and May. Under new federal rules, second-home and investment property mortgages can make up just 7% of a lender's total pipeline. That's on top of regulations that make it difficult to get a loan for condo towers in resort areas that may be used as short-term rentals.
"In addition to tighter lending rules, vacation-home buyers are starting to react to rising prices," said Redfin Chief Economist Daryl Fairweather. "Home prices have been climbing rapidly for the last several months, and it seems they've finally gotten prohibitively high for some people searching for second homes. Vacation-home buyers are quicker to back away from properties that are potentially overpriced because they're not a necessity. People searching for primary residences may have to shell out more money than they want to because they need a roof over their heads."
"A lot of the people who were driven to hunt for vacation homes over the last year have already bought them," Fairweather continued. "The pandemic and remote work drove many affluent Americans to relocate to vacation destinations, at least part of the time. But with offices reopening and life returning to some semblance of normal, people are less focused on fleeing to the beach or the lake."
Source: Redfin
Tue, 10 August 2021 | housing
July housing trends show some good news for first time buyers. New listings grew on a yearly basis for the fourth month in a row as sellers added a higher number of smaller homes to the market, according to the Realtor.com® Monthly Housing Report released today. Growth in the U.S. median listing price continued to moderate last month, but data shows some of this trend can be attributed to the increase in lower-priced homes for sale.
Nationally, the number of homes for sale declined 33.5% year-over-year in July. While inventory is still lower compared to last year, the rate of decline is improving, especially at more affordable price points. If this trend continues, there could be some relief on the horizon for first time buyers looking for smaller homes.
"July housing trends show a market still working its way back toward some version of normal. The feverish pace of home sales is beginning to follow historical seasonal patterns, while new listings grew at an unusually high rate for the summer months, further helping the inventory crunch," said Realtor.com® Chief Economist Danielle Hale. "This is shifting the housing market balance in a more buyer-friendly direction, but buyers may not see as much price moderation as suggested by the national trend because it's partly attributed to a shift toward smaller homes for sale. Still, if these changing inventory dynamics continue, we could see a wave of real estate activity heading into the latter part of the year."
Summer surge in new listings continues; inventory declines improve across the board
Although new listings growth is still below typical 2017-2019 levels (-9.5%), more new sellers entered the market in July (+6.5% year-over-year), which was higher than June's 5.5% increase year-over-year. Newly listed homes typically decline from June to July, but this year they held steady at -0.6% over June.
These newly listed homes tend to be smaller in size than last year, which has shifted the mix of available inventory. Looking at the single family home category alone, the share of homes having between 750 and 1,750 square feet increased from 30.2% in July 2020 to 36.3% in July 2021, while the inventory of homes having between 3,000 and 6,000 square feet decreased from 24.2% to 20.1%.
Locally, new listings grew 11.1% year-over-year in the nation's 50 largest metros, with more than half posting double-digit gains, led by a mix of cities across the country: Columbus, Ohio (+42.9%), Baltimore (+36.9%), Cleveland, Ohio (+35.8%), Milwaukee, Wis. (+34.3%) and Richmond, Va. (+30.1%). The biggest regional new listings increases were in the Midwest, up 19.8%, and West, up 11.3%.
U.S. home price gains moderate due to more affordable homes being listed
In July, the U.S. median list price held steady at last month's record-high of $385,000, up 10.3% year-over-year. However, prices are slightly moderating from the June growth rate of +12.7% as more affordable homes were being listed this July compared to last year. Looking at trends for a benchmark, 2,000 square-foot single-family home, we see that price growth in July continued at a brisk pace, with prices up 18.6% year-over-year.
The largest U.S. metros saw the third straight month of single-digit listing price growth in July, at an increase of 3.9% over last year. Additionally, 22 of the 50 biggest markets saw lower median listing prices in July compared to last year, but this can be attributed to an increase in smaller, more affordable inventory. Regionally, the West posted the biggest yearly price gain (+9.7%), with the highest big metro increases seen in Austin (+36.6%), Las Vegas (+20.6%) and Riverside (+20.0%).
Feverish pace of home sales begins to see more typical summer seasonality
The typical U.S. home spent 38 days on the market in July, 22 days faster than last year and 23 days faster than the 2017-2019 July average, a more normal pre-Covid housing market. In a sign of a return to typical seasonality, however, this was one day slower than the record 37 day time on market in June. Four metros tied for the fastest time on market in July, at a median 17 days: Columbus, Denver, Nashville and Rochester, N.Y.
Homes sold even faster compared to last year in many of the 50 largest U.S. metros, which saw time on market decline by an average 17 days year-over-year in July, with the steepest regional drop in the South (-22 days). Additionally, the three metros where homes sold fastest in July compared to last year were all in the South: Miami, at a wide margin of 61 days faster, along with Raleigh (-33 days) and Jacksonville (-30 days).
July 2021 Housing Overview by Top 50 Largest Metros
Metro |
Median |
Median |
Active |
New |
Median |
Median |
Atlanta-Sandy Springs-Roswell, Ga. |
$400,000 |
14.2% |
-41.3% |
9.4% |
31 |
-19.5 |
Austin-Round Rock, Texas |
$536,000 |
36.6% |
-44.0% |
12.7% |
20 |
-24.5 |
Baltimore-Columbia-Towson, Md. |
$349,000 |
-1.7% |
-18.5% |
36.9% |
34 |
-9 |
Birmingham-Hoover, Ala. |
$270,000 |
-1.8% |
-34.0% |
12.4% |
35 |
-21.5 |
Boston-Cambridge-Newton, Mass.-N.H. |
$679,000 |
0.6% |
-22.6% |
-10.7% |
30 |
-7 |
Buffalo-Cheektowaga-Niagara Falls, N.Y. |
$240,000 |
-1.0% |
-14.8% |
3.4% |
30 |
-9.5 |
Charlotte-Concord-Gastonia, N.C.-S.C. |
$389,000 |
5.3% |
-37.0% |
6.4% |
28 |
-20.5 |
Chicago-Naperville-Elgin, Ill.-Ind.-Wis. |
$350,000 |
0.4% |
-21.5% |
1.1% |
35 |
-7 |
Cincinnati, Ohio-Ky.-Ind. |
$330,000 |
-3.1% |
-15.3% |
16.0% |
30 |
-17 |
Cleveland-Elyria, Ohio |
$215,000 |
-8.6% |
-8.9% |
35.8% |
36 |
-15.5 |
Columbus, Ohio |
$305,000 |
-8.1% |
-6.8% |
42.9% |
17 |
-20.5 |
Dallas-Fort Worth-Arlington, Texas |
$395,000 |
9.8% |
-47.3% |
6.7% |
29 |
-18 |
Denver-Aurora-Lakewood, Colo. |
$600,000 |
10.2% |
-39.8% |
1.6% |
17 |
-19 |
Detroit-Warren-Dearborn, Mich. |
$278,000 |
-0.9% |
-27.1% |
10.6% |
23 |
-15 |
Hartford-West Hartford-East Hartford, Conn. |
$340,000 |
13.7% |
-59.8% |
-16.3% |
29 |
-14 |
Houston-The Woodlands-Sugar Land, Texas |
$365,000 |
11.4% |
-34.4% |
7.4% |
36 |
-16.5 |
Indianapolis-Carmel-Anderson, Ind. |
$280,000 |
-7.5% |
-31.6% |
19.7% |
35 |
-13.5 |
Jacksonville, Fla. |
$351,000 |
9.8% |
-52.6% |
12.5% |
36 |
-30 |
Kansas City, Mo.-Kan. |
$330,000 |
-6.0% |
-17.2% |
13.0% |
38 |
-14.5 |
Las Vegas-Henderson-Paradise, Nev. |
$410,000 |
20.6% |
-39.0% |
5.3% |
25 |
-23.5 |
Los Angeles-Long Beach-Anaheim, Calif. |
$999,000 |
0.5% |
-19.3% |
5.2% |
43 |
-11 |
Louisville/Jefferson County, Ky.-Ind. |
$270,000 |
-6.9% |
-19.3% |
29.2% |
23 |
-20.5 |
Memphis, Tenn.-Miss.-Ark. |
$245,000 |
-5.8% |
-27.4% |
25.3% |
36 |
-14.5 |
Miami-Fort Lauderdale-West Palm Beach, Fla. |
$450,000 |
11.5% |
-48.1% |
-7.7% |
59 |
-60.5 |
Milwaukee-Waukesha-West Allis, Wis. |
$290,000 |
-20.0% |
0.3% |
34.3% |
29 |
-18 |
Minneapolis-St. Paul-Bloomington, Minn.-Wis. |
$365,000 |
-0.6% |
-22.9% |
0.2% |
30 |
-9.5 |
Nashville-Davidson--Murfreesboro--Franklin, Tenn. |
$449,000 |
15.1% |
-61.0% |
-26.5% |
17 |
-14 |
New Orleans-Metairie, La. |
$341,000 |
8.3% |
-21.7% |
28.7% |
45 |
-27 |
New York-Newark-Jersey City, N.Y.-N.J.-Pa. |
$599,000 |
0.8% |
-12.9% |
-16.0% |
59 |
-4 |
Oklahoma City, Okla. |
$285,000 |
0.4% |
-40.9% |
6.1% |
37 |
-9 |
Orlando-Kissimmee-Sanford, Fla. |
$363,000 |
13.5% |
-51.2% |
-3.1% |
37 |
-26 |
Philadelphia-Camden-Wilmington, Pa.-N.J.-Del.-Md. |
$325,000 |
-4.4% |
-6.9% |
20.5% |
40 |
-6 |
Phoenix-Mesa-Scottsdale, Ariz. |
$475,000 |
15.4% |
-24.4% |
26.3% |
29 |
-21 |
Pittsburgh, Pa. |
$247,000 |
-1.2% |
-22.9% |
6.8% |
39 |
-16.5 |
Portland-Vancouver-Hillsboro, Ore.-Wash. |
$564,000 |
12.8% |
-26.6% |
14.4% |
32 |
-13 |
Providence-Warwick, R.I.-Mass. |
$430,000 |
-1.0% |
-27.1% |
10.1% |
29 |
-21 |
Raleigh, N.C. |
$412,000 |
7.4% |
-64.4% |
-19.8% |
18 |
-33 |
Richmond, Va. |
$348,000 |
-2.6% |
-29.3% |
30.1% |
37 |
-15.5 |
Riverside-San Bernardino-Ontario, Calif. |
$540,000 |
20.0% |
-13.6% |
19.0% |
27 |
-27 |
Rochester, N.Y. |
$240,000 |
-4.0% |
-24.1% |
12.0% |
17 |
-12 |
Sacramento--Roseville--Arden-Arcade, Calif. |
$597,000 |
13.7% |
-18.5% |
19.4% |
28 |
-13 |
San Antonio-New Braunfels, Texas |
$338,000 |
7.1% |
-44.9% |
14.1% |
35 |
-23 |
San Diego-Carlsbad, Calif. |
$830,000 |
4.7% |
-0.1% |
7.5% |
37 |
-2 |
San Francisco-Oakland-Hayward, Calif. |
$1,000,000 |
-4.8% |
-20.6% |
5.1% |
29 |
-4.5 |
San Jose-Sunnyvale-Santa Clara, Calif. |
$1,250,000 |
2.7% |
-17.4% |
23.4% |
28 |
-6 |
Seattle-Tacoma-Bellevue, Wash. |
$695,000 |
10.3% |
-37.4% |
-2.9% |
30 |
-4.5 |
St. Louis, Mo.-Ill. |
$250,000 |
-0.7% |
-20.2% |
23.4% |
40 |
-21 |
Tampa-St. Petersburg-Clearwater, Fla. |
$350,000 |
17.4% |
-47.7% |
3.5% |
35 |
-24 |
Virginia Beach-Norfolk-Newport News, Va.-N.C. |
$315,000 |
-5.3% |
-32.3% |
7.9% |
25 |
-19.5 |
Washington-Arlington-Alexandria, DC-Va.-Md.-W. Va. |
$515,000 |
-2.8% |
10.8% |
29.7% |
30 |
-2 |
Source: Realtor.com
Wed, 20 October 2021 | housing
New data from Bank of America shows that family support often plays a pivotal role in helping first-generation homebuyers reach the major milestone of purchasing their first home. Families of first-generation homeowners often instilled in them the dream to buy a home and an understanding of the value of owning – whether they were able to provide financial support, or simply motivation.
"For many first-generation homeowners and their families, homeownership has a unique importance, given the collective efforts to overcome financial challenges that can often span generations," said AJ Barkley, Head of Neighborhood and Community Lending at Bank of America. "Achieving this goal can create a sense of pride and accomplishment that resonates both for the buyer and those closest to them, including their parents and future generations."
Published today, Bank of America's 2021 Homebuyer Insights Report: First-Generation Homeowner Spotlight is based on a survey of U.S. adults who currently own a home or plan to in the future. The study found:
Sheena C. is a first-generation homeowner and Philadelphia native who moved to Detroit several years ago. "I view homeownership not only as a way to build generational wealth for me and my young daughter, but to also have a stake in a neighborhood," said Sheena. "I immediately connected to the vibrant community in Detroit and decided to put down roots."
The path to homeownership begins with saving and building credit
Homeownership remains one of the most common methods for families and individuals to build wealth, as homes historically appreciate over time. When the home increases in value, so does the amount of equity that is available to the homeowner. It is this equity that can be used to support the next generation.
However, the path to homeownership begins long before searching for a home. "The journey toward homeownership – whatever your timeline – actually begins with your first banking experience and continues as you learn to budget, save and establish a solid credit history," said Barkley. "Building financial confidence takes time and requires making early, consistent and informed decisions that set you up for success."
Prospective homebuyers say saving for a home is a financial priority, but they face hurdles, much like the generations before them. Only 24% of prospective buyers are proud of their credit score and 89% say they know there's more they could do to save money.
Overcoming barriers through planning and assistance
"While homeownership may feel like a distant dream, knowing the stepping stones and solidly planting one foot in front of the next can put you closer to your goal," says Barkley.
Bank of America is helping people get on the right path with a range of solutions starting with help managing spending and saving patterns and practicing responsible credit behavior. The bank offers innovative low down payment mortgages, as well as down payment and closing cost grants (no repayment required) designed to make homeownership accessible and affordable for those with a healthy financial picture.
While many prospective buyers can afford monthly mortgage payments, they report high rent costs (57%) and expensive home prices (54%) are making it harder to save for the upfront costs of homeownership. That's why Bank of America's Community Homeownership Commitment® was created – to address the challenges many would-be buyers face. Already, the Community Homeownership Commitment has provided over $270 million in grants to more than 29,000 homebuyers.
Sheena, the Detroit homeowner, is just one of many who took advantage of Bank of America's Down Payment Grant and America's Home Grant® to close on a home earlier this year. "After hours of research to understand the home buying process, things just aligned when I applied and qualified for down payment assistance from Bank of America," she said. "I knew that help with upfront costs would enable me to replace rent payments with regular mortgage payments, giving me a stronger sense of stability that a month-to-month lease could not offer."
Source: Bank of America
Wed, 22 December 2021 | real estate
Homeowners in the US have earned $ 9.1 trillion in increased property values over the past year, as home prices continued to rise due to an acute shortage of real estate, according to a new report by Redfin (redfin.com). US home values rose 31.4% year on year to $ 38.3 trillion last month, well above the 9.7% year on year ($ 2.6 trillion) recorded in November last year. Housing prices rose sharply during the pandemic as mortgage rates hit record lows, teleworking and the skyrocketing stock market boosted demand for housing amid continuing housing shortages. November marked the 16th straight month of double-digit price increases as the number of homes for sale fell to an all-time low.
“The rise in property values during the pandemic has widened the gap between homeowners and tenants in America. Homeowners' wealth has improved significantly over the past year, while tenants have lost those income and are now trapped in rent inflation, ” according to Daryl Fairweather, chief economist at Redfin.
“On the other hand, property values have gone up not only in wealthy big cities. Homeowners in rural America who typically don't see significant increases in home values are also reaping the benefits of a booming real estate market. ”
The value of rural houses in November increased by 46.2% year-over-year to US$4.9 trillion. In contrast, the value of urban homes rose by 31.3% to US$8 trillion, while the value of suburban homes rose by 25.9% to US$24.1 trillion. As cities recover from the slowdown in coronavirus growth, rural areas are still more popular than before the pandemic, as remote workers continue to seek additional space and relative convenience.
Condominiums rose 42.7% year-over-year to $ 5.1 trillion in November. By comparison, the value of single-family homes increased 30.1% to $ 32 trillion, while the value of townhouses rose 20.6% to $ 1.2 trillion. The pandemic hit the condominium market hard in 2020, when dozens of Americans traded cramped city life and shared amenities for larger homes in the suburbs and rural areas. But when restrictions on isolation were eased and the initial shock of the pandemic died down, condominiums and city life began to return. This explains why the value of condominiums has increased significantly compared to last year.
Home values in Austin, Texas rose 48.1% year-over-year to $ 389.5 billion in November, the largest increase among the 50 most populous metropolitan areas in the United States. It is followed by Jacksonville, Florida (39.9%) and Phoenix, Arizona (38.3%). Tampa, Florida and Riverside, California completed the top five with growth of 36% and 32%, respectively. During the pandemic, home buyers flocked to the Sun Belt states as telecommuting allowed them to prioritize accessibility over proximity to the office. Austin, Phoenix and Tampa have consistently been some of the hottest spots for home buyers looking to relocate during the pandemic.
Source: Redfin.com
Fri, 22 April 2022 | housing
Homebuyer demand softened further over the last several weeks, as a typical slump in buying and selling over Easter and Passover weekend amplified a recent slowdown triggered by surging mortgage rates and housing costs. That’s according to a new report from Redfin (redfin.com)
Roughly 1 in 8 sellers cut their list prices during the four weeks ending April 17—the highest share in five months—and asking prices declined slightly from the previous four-week period. Redfin's Homebuyer Demand Index—a measure of requests for home tours and other home-buying services from Redfin agents—fell 4% year over year during the holiday week in its first drop since June. Mortgage applications and online searches for “homes for sale” also slumped.
More buyers have moved to the sidelines as home prices have hit historic highs and mortgage rates have jumped past 5%. The median home-sale price is up 17% year over year to a record $392,750 and mortgage rates are now at the highest level since April 2010, sending the typical homebuyer’s monthly payment up 38% to an all-time high of $2,318. Still, some measures of competition, including the share of homes selling above list price and the share selling in one week, continue to hit new records.
“The lull in homebuying and selling activity that we saw over Easter and Passover is likely to continue well past the holiday weekend,” said Redfin Chief Economist Daryl Fairweather. “The forces causing many homebuyers to pump the brakes are still in place—increasing mortgage rates and record-high home prices. We expect price increases to slow and buyers in bidding wars to face fewer competing offers, but substantial relief for homebuyers is unfortunately still well beyond the horizon since the housing market is still tilted further in sellers’ favor than at any time in history.”
Leading indicators of homebuying activity:
Most metrics in this section measure a one-week period that includes Easter and Passover. Year-over-year declines are amplified due to the fact that the same period one year earlier was a non-holiday week.
While sellers still have the upper hand, buyers are beginning to wield a bit more power, according to Redfin Los Angeles real estate agent Heidi Ludwig.
“Buyers are becoming more discerning. They’re less willing to overpay because now they’re only facing three or four competitive offers instead of dozens. Sellers may get frustrated if home-price growth starts to slow, but they should still be able to command excellent prices for their home as long as they price appropriately and put the work in to make their home as appealing as possible. This means staging, deep cleaning, a fresh paint job and landscaping—things that were not as necessary when the market was white-hot.”
Key housing market takeaways for 400+ U.S. metro areas:
Unless otherwise noted, this data covers the four-week period ending April 17. Redfin’s weekly housing market data goes back through 2015.
Source: Redfin
Thu, 14 July 2022 | economy housing
Single-family home prices increased at the annualized rate of 19.4 percent in Q2 2022, down slightly from the previous quarter's upwardly revised 20.5 percent, according to Fannie Mae's latest Home Price Index (FNM-HPI) reading, a national, repeat-transaction home price index measuring the average, quarterly price change for all single-family properties in the United States, excluding condos. On a quarterly basis, home prices rose a seasonally adjusted 4.3 percent in Q2 2022.
"Home prices maintained a near-historic pace of appreciation in the second quarter, as low levels of housing inventory continued to support price growth," said Doug Duncan, Fannie Mae Senior Vice President and Chief Economist. "At the end of 2021 and extending into 2022, we believe many homebuyers pulled forward their purchase plans to avoid expected increases in mortgage rates, contributing to demand for homes and strong price appreciation. Given the sharp rise in mortgage rates since that time, and the resulting negative impact on affordability to potential homebuyers, we expect purchase demand to cool in the quarters ahead, and for home price appreciation to moderate as a result."
The FNM-HPI is produced by aggregating county-level data to create both seasonally adjusted and non-seasonally adjusted national indices that are representative of the whole country and designed to serve as indicators of general single-family home price trends. The FNM-HPI is publicly available at the national level as a quarterly series with a start date of Q1 1975 and extending to the most recent quarter, Q2 2022. Fannie Mae publishes the FNM-HPI approximately mid-month during the first month of each new quarter.
Source: Fannie Mae
Wed, 27 July 2022 | housing
Finance of America Reverse LLC (FAR), a leader in retirement solutions asked The Harris Poll to conduct a survey of 2,000 homeowners in the United States aged 18 or older to gain an understanding about home equity, its potential uses, and how it can be used to help homeowners achieve their long-term financial goals.
It was found that older homeowners are less likely to use home equity loans than those in younger generations. This is despite the fact that older homeowners are more likely to benefit from these financing options with U.S. homeowners over 62 having more than $10.6 trillion in property wealth. There are many factors that explain why 94% of Silent Generation and 89% of Baby Boomer respondents said they would not use home equity products. These include a reticence about considering the merits of home equity, lack of knowledge regarding product benefits, misaligned expectations of financial advisors recommending home equity solutions for clients.
These results highlight the need to have a better understanding of how housing wealth leverage can benefit older homeowners. This includes a deeper understanding among financial advisors. Surprisingly, 90% of respondents who have consulted a financial advisor believe they would recommend a home equity loan to them if it was in their best interests. Only 29% of respondents who have consulted a financial advisor about a home equity loan have spoken to them. This data is consistent with industry data. A recent study by The Academy of Home Equity in Financial Planning found that nearly three-quarters of financial advisors (63%) are unable to talk about home equity or don't know how to. FAR sees this gap as an opportunity for consumers and financial advisors alike to learn more about the stabilizing effects of housing wealth for 55+ homeowners, and for senior lending experts to participate in the retirement planning conversation.
FAR President Kristen Sieffert believes these findings are a prime opportunity for FAR to further leverage its education-first approach towards home equity and use a reverse mortgage in a holistic retirement strategy. Sieffert stated, "Older homeowners have an amazing opportunity in today’s housing market to tap into another vital source of financing. Given the historical home values, tapping into home equity might make sense when you consider how many older Americans live on a fixed income. FAR's partnership with the Financial Planning Association, and our consumer marketing efforts, have long supported the belief that a majority of older Americans don't consider home equity when planning for retirement. These results confirm FAR's long-held belief and advocacy. It is important that we continue to show how homeowners can incorporate this asset into their retirement plan. A reverse mortgage, a home equity product like a reverse loan, may make a difference for thousands of homeowners in the United States. It could be what they need to thrive during volatile years.
Home Equity Punch list
These survey results provide insight into how homeowners might use their home equity. They also reveal the various factors that affect homeowners' perceptions of home equity and home-equity products. Here is a summary of some high-level findings which will be tracked and analysed on an ongoing basis in order to give an overview of the U.S. home equity landscape.
Detailed Survey Results
Homeowners closest to retirement are less likely to use their home equity
Older homeowners of the Silent Generation and Baby Boomer generations are more likely than younger homeowners to tap into their home equity. However, they are less likely to actually consider it because of risk perceptions, insufficient product awareness and perceived need.
The Silent Generation and Boomers were less familiar with HECMs and HELOCs than the younger generations. All respondents had low knowledge of the features of home equity loans.
Homeowners Should Make Preparing for Retirement a Priority
Respondents of all ages expressed strong desire to save for retirement and plan for their future. They also wanted to retire as early as possible. However, most people worry about whether or not they will achieve the lifestyle they desire in later life.
The older generations expressed strong interest in retirement and in aging in place, as well as reducing their costs.
Home Equity Education Could be a Benefit to Both Homeowners And Financial Advisors
Although financial advisors are trusted resources for information about finances and retirement planning, only a small number of them include home equity in their planning conversations with clients. Financial advisors and clients may have misaligned expectations or little knowledge about home equity products. This can complicate these conversations. Financial advisors may not be licensed to sell home-equity products. This could be because other professionals might be required to make informed recommendations on how to use home equity. Homeowners should seek out information and resources on how to manage their home equity. If they are interested, they should consult a licensed loan officer.
Respondents' desire to reduce and manage their debt and to learn more about home equity could make it a good opportunity to increase awareness and provide financial advisors with additional information to help clients achieve their goals.
Jason Rudman, Chief Customer Officer of Finance of America Companies said that homeowners have more equity than ever before. Finance of America offers a wide range of home equity and home financing options that are flexible and affordable. This includes home improvement loans, reverse and hybrid retirement mortgages, and other innovative products. We are proud to offer such a wide range of products and to provide strategic guidance to our customers about how to use their home equity throughout their financial journey.
For a more in-depth look at the Home Equity Punch List, please visit http://exploreretirement.far.com/homeequitypunchlist to access additional data and insights from the survey.
Thu, 01 June 2023 | housing
The everyday expenses of owning a home are higher than ever, according to a new analysis from Zillow® and Thumbtack. Utility bills, property taxes, insurance and essential home maintenance can add up to $14,155 a year for the average U.S. homeowner. That's an additional $1,180 per month on top of a typical mortgage payment. First-time home buyers facing affordability challenges in today's market need to understand and budget for these less obvious expenses when calculating how much home they can afford.
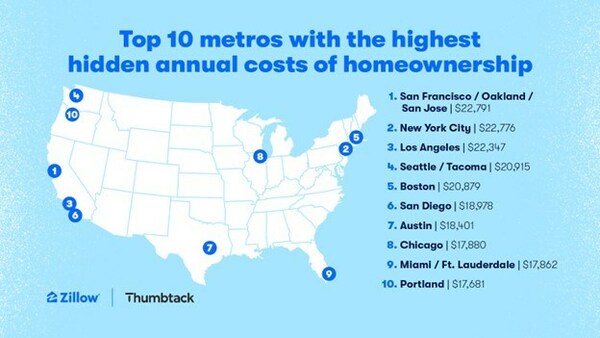
Zillow and Thumbtack: Top 10 metros with the highest hidden annual costs of homeownership
These costs can be surprisingly high in already pricey metro areas, topping $22,000 annually in San Francisco, New York and Los Angeles. Of the 39 metro areas analyzed, hidden homeownership costs are the lowest in Las Vegas ($9,886); Asheville, North Carolina ($11,318); and St. Louis ($11,824).
Zillow and Thumbtack's research looked at three unavoidable expenses for single-family homeowners — property taxes, homeowners insurance and utility payments (energy, water, natural gas and internet) — and found they averaged $7,742 in total nationally. New Yorkers pay the highest property taxes, topping $9,000 per year, while utilities cost the most in Hartford, Connecticut, averaging $4,443 a year. Costs for homeowners insurance vary based on home value, so homeowners in the most affordable metro areas, such as Pittsburgh and Cleveland, have the added benefit of lower insurance bills.
The analysis also considered Thumbtack's 17 essential home maintenance projects, based on data from millions of home projects completed across the country. These projects average a combined $6,413 annually. The average cost of upkeep is highest in Los Angeles and Chicago, totaling $8,639 and $7,722 respectively. Meanwhile, homeowners in Las Vegas can expect to pay just $3,467 per year to maintain their homes.
"Just like you would visit a mechanic for regular tune-ups to help keep your car in good condition and avoid big bills, your home needs the same routine maintenance to ensure that everything is running smoothly," said David Steckel, Thumbtack's home expert. "Staying on top of annual home maintenance will not only increase the value of your home, but will also help prevent emergency repairs that can wreck a homeowner's budget."
First-time buyers make up nearly half of all home shoppers (45%), and they may be caught off guard by these costs and fail to account for them when budgeting for a home. By starting with the Home Loans tab on Zillow's homepage, shoppers can use an affordability calculator to figure out how much they can afford and then connect with a loan officer to establish not only what mortgage they qualify for, but what they're comfortable paying, given these additional costs. With that budget in hand, buyers can then use a new app filter on Zillow to shop for homes by monthly cost, instead of by purchase price.
"Understanding all the costs that come with homeownership can not only impact a buyer's budget, but the type of home they shop for, too," said Zillow home trends expert Amanda Pendleton. "While a big backyard or a larger home may be appealing, it's important to consider how much maintaining those spaces could cost. Buyers may want to consider affordable alternatives to single-family homes, or spend more upfront on a new-construction home that could need less maintenance in the near term."
Once buyers have closed the deal, Thumbtack is the go-to partner to help care for your new home. By entering their home's location and features on Thumbtack, homeowners can receive personalized guidance on what projects to complete, when to complete them and who to hire to get the job done. This will help homeowners create prioritized maintenance plans that are within their budget to cover everything from the move-in house cleaning to tree trimming and roof maintenance.
Thu, 01 June 2023 | economy housing
Home prices rose slightly in May, but price growth slowed to the lowest rate on record since 2016, suggesting home prices may not see a new peak in 2023, according to the Realtor.com® Monthly Housing Trends Report released today. Additionally, home inventory growth continues to slow and is declining in many metro areas across the country as fewer sellers list their homes than last year and buyers compete over the remaining affordable homes for sale.
"April and May are historically popular months to buy, and typically by this time in the year we've exceeded the prior year's peak home price. Weakening home price growth for the past 12 months is increasing the odds that we may not see a new home price peak this year, for the first time in the history of our listing data, which dates back to mid-2016, and this is likely welcome news to homeshoppers," said Danielle Hale, Chief Economist for Realtor.com®. "Despite stalling price growth, home listing prices are up slightly compared to last May, and with rates more than a percentage point higher than a year ago, buyers continue to face affordability headwinds. The good news for sellers is that buyers are still out there, and this month's slower growth in the active inventory of homes for sale indicates that shoppers are in the market and actively searching for homes that fit their needs and budget."
What it means for homebuyers, sellers, and the housing market
A slower housing market means buyers in certain areas may find they can once again have an offer accepted when putting less down. A recent report from Realtor.com® found down payments declined for the first time since the second quarter of 2020, suggesting it's getting harder for buyers to keep up with costs and that a less competitive housing market may be opening up opportunities for buyers making somewhat smaller down payments. Fortunately, there are a number of down payment assistance programs also available to help buyers, who can search for programs using this tool on Realtor.com®.
"As buyers' budgets are being stretched to the max, there are opportunities for negotiation, especially on homes that have been sitting on the market for a while," said Realtor.com® Executive News Editor Clare Trapasso. "They can ask sellers to come down on the price, make costly repairs, as well as contribute to their closing costs or buy down their mortgage rates. If they're purchasing new construction, they can also request upgrades. This can add up to substantial savings."
May 2023 Housing Metrics – National
| Metric | Change over May 2022 | Change over May 2019 |
| Median listing price | +0.9% (to $440,000) | +38.0 % |
| Median listing price per square foot | -0.3% (to $225) | +47.1 % |
| Active listings | +21.5 % | -50.7 % |
| New listings | -22.7 % | -30.4 % |
| Median days on market | +14 days (to 43 days) | -9 days |
| Share of active listings with price reductions | +2.6 percentage points (to 12.7%) | -2.6 percentage points |
Home price growth stalls
Home listing prices were slightly higher in May compared to a year ago, but growth in the typical asking price of for-sale homes continued to decline to the low single digits. In addition, the median listing price on a square foot basis declined compared to last year for the first time in Realtor.com® data history. At this rate of slowing, asking prices are likely to decline relative to the previous year by next month. Despite this trend, home sellers continue to have high expectations of the housing market and buyers, in some cases, too high. The number of homes with price reductions – a sign that a seller needed to adjust pricing to attract a buyer – was higher than year ago levels but in line with pre-pandemic years.
Inventory tightens as fewer sellers list and buyers compete over remaining homes
The U.S. supply of active homes for sales continued to grow in May relative to this time last year, but slowed for the third month in a row as fewer potential sellers opted to list their home for sale and as the market lapped the period of higher inventory growth that started in May 2022. Today's buyers are grappling with low inventory, but the slowing growth in active inventory in May indicates that buyers continue to search for and find deals. Despite sitting on relatively high home equity, sellers are staying on the sidelines, and the number of newly listed homes remains well below last year's level. In fact, the pace of new home listings in May was even lower than in May 2020 when the real estate market was still contending with pandemic-era closures and restrictions.
More days on market gives buyers time to search for homes and bargain
In May, the typical home spent two weeks longer on the market than the same time last year, but a shrinking difference since January's recent high suggests buyers are out shopping for homes and competition still exists. That's keeping sellers in a very good position, with well-priced, updated homes still attracting buyers and selling more than a week faster than was common before the pandemic.
May 2023 Housing Overview by Top 50 Largest Metros
| Metro Area | Median Listing Price | Median Listing Price YoY | Median Listing Price per Sq. Ft. YoY | Active Listing Count YoY | New Listing Count YoY | Median Days on Market | Median Days on Market Y-Y (Days) | Price Reduced Share | Price Reduced Share Y-Y (Percentage Points) |
| Atlanta-Sandy Springs-Alpharetta, Ga. | $434,000 | 1.0 % | -0.3 % | 25.4 % | -22.6 % | 40 | 10 | 12.0 % | 2.0 pp |
| Austin-Round Rock-Georgetown, Texas | $584,000 | -7.3 % | -7.7 % | 112.5 % | -20.2 % | 44 | 28 | 29.8 % | 11.9 pp |
| Baltimore-Columbia-Towson, Md. | $350,000 | 0.0 % | 2.9 % | -8.4 % | -25.4 % | 36 | 6 | 10.5 % | 0.8 pp |
| Birmingham-Hoover, Ala. | $297,000 | 1.6 % | 3.1 % | 40.6 % | -9.8 % | 43 | 12 | 11.7 % | 3.5 pp |
| Boston-Cambridge-Newton, Mass.-N.H. | $867,000 | 14.5 % | 5.8 % | -3.6 % | -26.2 % | 23 | 8 | 10.4 % | 1.0 pp |
| Buffalo-Cheektowaga, N.Y. | $253,000 | 5.8 % | 7.4 % | 6.9 % | -17.4 % | 30 | 9 | 6.1 % | 0.6 pp |
| Charlotte-Concord-Gastonia, N.C.-S.C. | $435,000 | 1.1 % | 1.3 % | 34.6 % | -28.4 % | 39 | 19 | 11.1 % | -0.3 pp |
| Chicago-Naperville-Elgin, Ill.-Ind.-Wis. | $376,000 | 5.9 % | -1.1 % | -18.5 % | -28.5 % | 34 | 6 | 8.9 % | -0.1 pp |
| Cincinnati, Ohio-Ky.-Ind. | $390,000 | 19.9 % | 8.2 % | 2.7 % | -22.7 % | 32 | 11 | 8.6 % | 1.5 pp |
| Cleveland-Elyria, Ohio | $237,000 | 9.1 % | 4.6 % | -0.5 % | -18.1 % | 38 | 5 | 8.8 % | 0.4 pp |
| Columbus, Ohio | $394,000 | 12.8 % | 4.9 % | 7.3 % | -22.1 % | 22 | 11 | 12.4 % | 4.0 pp |
| Dallas-Fort Worth-Arlington, Texas | $469,000 | -1.4 % | -3.3 % | 62.9 % | -16.2 % | 37 | 16 | 16.7 % | 7.5 pp |
| Denver-Aurora-Lakewood, Colo. | $682,000 | -1.8 % | 3.3 % | 27.7 % | -26.5 % | 25 | 15 | 16.7 % | 4.9 pp |
| Detroit-Warren-Dearborn, Mich. | $267,000 | -2.4 % | -0.1 % | -4.9 % | -22.4 % | 30 | 10 | 12.3 % | 0.7 pp |
| Hartford-East Hartford-Middletown, Conn. | $425,000 | 17.2 % | 4.9 % | -26.0 % | -16.1 % | 19 | 4 | 3.8 % | -1.7 pp |
| Houston-The Woodlands-Sugar Land, Texas | $375,000 | -5.9 % | -3.2 % | 37.1 % | -14.8 % | 41 | 9 | 16.0 % | 4.0 pp |
| Indianapolis-Carmel-Anderson, Ind. | $347,000 | 9.2 % | 5.6 % | 31.3 % | -22.8 % | 36 | 11 | 15.6 % | 5.9 pp |
| Jacksonville, Fla. | $426,000 | -0.4 % | -0.9 % | 67.5 % | -25.2 % | 48 | 21 | 17.1 % | 7.4 pp |
| Kansas City, Mo.-Kan. | $463,000 | 15.7 % | 10.3 % | 27.6 % | -18.3 % | 52 | 15 | 9.5 % | 3.8 pp |
| Las Vegas-Henderson-Paradise, Nev.* | $450,000 | N/A | N/A | N/A | N/A | 46 | N/A | 14.0 % | N/A |
| Los Angeles-Long Beach-Anaheim, Calif. | $1,150,000 | 15.8 % | 5.9 % | -9.8 % | -31.5 % | 39 | 10 | 7.6 % | -2.3 pp |
| Louisville/Jefferson County, Ky.-Ind. | $324,000 | 9.0 % | 4.7 % | 2.4 % | -22.1 % | 31 | 12 | 12.6 % | 1.7 pp |
| Memphis, Tenn.-Miss.-Ark. | $325,000 | 11.1 % | 3.3 % | 83.8 % | -13.1 % | 43 | 12 | 15.6 % | 8.1 pp |
| Miami-Fort Lauderdale-Pompano Beach, Fla. | $608,000 | -2.3 % | 1.0 % | 55.2 % | -25.1 % | 63 | 27 | 12.5 % | 4.3 pp |
| Milwaukee-Waukesha, Wis. | $375,000 | 16.3 % | 9.7 % | -23.4 % | -24.0 % | 29 | 4 | 7.6 % | 0.4 pp |
| Minneapolis-St. Paul-Bloomington, Minn.-Wis. | $460,000 | 8.2 % | 3.6 % | -2.1 % | -24.4 % | 31 | 7 | 9.0 % | 0.8 pp |
| Nashville-Davidson-Murfreesboro-Franklin, Tenn. | $580,000 | 5.5 % | 0.9 % | 124.7 % | -15.4 % | 30 | 19 | 18.4 % | 6.2 pp |
| New Orleans-Metairie, La. | $345,000 | -1.1 % | 0.6 % | 81.0 % | -15.9 % | 57 | 19 | 20.9 % | 6.5 pp |
| New York-Newark-Jersey City, N.Y.-N.J.-Pa. | $735,000 | 8.9 % | 14.9 % | -10.0 % | -25.0 % | 48 | 10 | 7.8 % | -0.2 pp |
| Oklahoma City, Okla. | $354,000 | 8.5 % | 2.1 % | 65.0 % | -23.4 % | 43 | 14 | 15.4 % | 8.7 pp |
| Orlando-Kissimmee-Sanford, Fla. | $450,000 | 0.0 % | -0.5 % | 53.8 % | -28.2 % | 47 | 21 | 14.3 % | 5.6 pp |
| Philadelphia-Camden-Wilmington, Pa.-N.J.-Del.-Md. | $349,000 | 2.8 % | 3.1 % | -5.9 % | -28.8 % | 44 | 12 | 10.9 % | 0.7 pp |
| Phoenix-Mesa-Chandler, Ariz. | $529,000 | -3.6 % | -5.6 % | 28.7 % | -40.6 % | 45 | 24 | 19.1 % | 1.8 pp |
| Pittsburgh, Pa. | $238,000 | -0.7 % | -3.9 % | 3.6 % | -21.8 % | 46 | 9 | 12.9 % | 0.7 pp |
| Portland-Vancouver-Hillsboro, Ore.-Wash. | $639,000 | 7.0 % | -1.1 % | 21.5 % | -25.5 % | 35 | 12 | 13.5 % | -0.8 pp |
| Providence-Warwick, R.I.-Mass. | $540,000 | 14.3 % | 7.0 % | -10.7 % | -23.6 % | 31 | 10 | 5.7 % | -0.9 pp |
| Raleigh-Cary, N.C. | $474,000 | -4.2 % | -3.5 % | 72.7 % | -23.2 % | 43 | 31 | 11.2 % | 3.9 pp |
| Richmond, Va. | $441,000 | 15.6 % | 8.2 % | 19.3 % | -20.5 % | 40 | 9 | 6.0 % | 1.3 pp |
| Riverside-San Bernardino-Ontario, Calif. | $580,000 | -3.2 % | 0.4 % | -1.3 % | -32.8 % | 46 | 18 | 11.0 % | -2.5 pp |
| Rochester, N.Y. | $265,000 | 19.2 % | 13.1 % | -13.0 % | -24.3 % | 13 | 3 | 6.0 % | -1.2 pp |
| Sacramento-Roseville-Folsom, Calif. | $663,000 | 2.1 % | -3.4 % | -27.3 % | -33.3 % | 31 | 7 | 11.2 % | -5.5 pp |
| San Antonio-New Braunfels, Texas | $357,000 | -5.8 % | -2.7 % | 93.4 % | -9.5 % | 47 | 17 | 19.8 % | 9.1 pp |
| San Diego-Chula Vista-Carlsbad, Calif. | $1,055,000 | 13.8 % | 5.7 % | -25.7 % | -36.9 % | 30 | 8 | 8.8 % | -3.0 pp |
| San Francisco-Oakland-Berkeley, Calif. | $1,178,000 | 4.8 % | -1.7 % | -20.0 % | -24.2 % | 31 | 9 | 8.4 % | -0.6 pp |
| San Jose-Sunnyvale-Santa Clara, Calif. | $1,530,000 | 2.2 % | 0.2 % | -35.3 % | -37.4 % | 25 | 8 | 8.2 % | -2.0 pp |
| Seattle-Tacoma-Bellevue, Wash. | $823,000 | -0.3 % | 3.1 % | -10.8 % | -40.7 % | 29 | 14 | 10.2 % | 0.7 pp |
| St. Louis, Mo.-Ill. | $282,000 | 2.3 % | 4.7 % | 2.8 % | -19.3 % | 37 | 7 | 9.1 % | 2.0 pp |
| Tampa-St. Petersburg-Clearwater, Fla. | $439,000 | -0.2 % | -0.1 % | 66.9 % | -25.6 % | 46 | 22 | 17.7 % | 6.4 pp |
| Virginia Beach-Norfolk-Newport News, Va.-N.C. | $387,000 | 10.6 % | 5.9 % | -2.5 % | -24.3 % | 29 | 8 | 9.5 % | -0.2 pp |
| Washington-Arlington-Alexandria, DC-Va.-Md.-W. Va. | $639,000 | 9.3 % | 3.2 % | -15.6 % | -28.7 % | 30 | 6 | 8.8 % | -1 pp |
| *Some Las Vegas listing metrics have been excluded while data is under review. |
Thu, 01 June 2023 | housing interest rates
Pending home sales fell 17% from a year earlier during the four weeks ending May 28, one of the biggest declines since the start of the year. That’s according to a new report from Redfin (redfin.com), the technology-powered real estate brokerage. That year-over-year drop is especially notable because pending sales had already started falling at this time last year as mortgage rates shot up past 5%.
Seasonally adjusted measures of homebuying demand show that it has also dipped in earlier stages of the house hunting journey. Mortgage-purchase applications and Redfin’s Homebuyer Demand Index—a measure of home tours and other service requests from Redfin agents—are both down about 7% from a month ago. The Demand Index was up 1% from a year earlier, its first annual increase in more than 12 months. It’s worth noting this measure was dropping quickly a year ago due to rising rates.
Homebuying demand has dipped over the last month due to elevated mortgage rates and a scarcity of homes for sale. Average weekly rates hit 6.79% this week, their highest level since November. That has priced many people out of the housing market; the typical U.S. homebuyer’s monthly housing payment hit a record high of $2,651 this week, up roughly $350 from a year ago. Limited inventory is also a major factor holding back sales: New listings dropped 23% year over year, and the total number of homes for sale fell 3%, the second annual decline in 12 months (the first was during the prior four-week period, when they fell 0.2%). The lack of homes on the market is propping up prices, with the median U.S. sale price down 1.9% year over year, the smallest decline in two months.
Bay Equity, Redfin’s mortgage company, reports that many prospective buyers haven’t bowed out entirely. They’re ready to make offers and lock in mortgages when rates drop down closer to 6% and more listings hit the market.
“It’s been a weird week,” said Heather Mahmood-Corley, a Redfin Premier agent in Phoenix. “Some buyers are putting in all-cash offers. Other house hunters have put their search on hold, waiting for mortgage rates to come down and more listings to come on the market, and some of the more financially savvy buyers are moving forward with mortgage-rate buydowns or plans to refinance in the future. The silver lining of today’s housing market is that limited listings are propping up prices, making it so sellers are still able to get a favorable price.”
Leading indicators of homebuying activity:
Key housing market takeaways for 400+ U.S. metro areas:
Unless otherwise noted, this data covers the four-week period ending May 28. Redfin’s weekly housing market data goes back through 2015. For bullets that include metro-level breakdowns, Redfin analyzed the 50 most populous U.S. metros. Select metros may be excluded from time to time to ensure data accuracy.
To view the full report, including charts, please visit: https://www.redfin.com/news/housing-market-update-mortgage-rates-up-home-sales-down

Lorem ipsum dolor sit amet, consectetur adipiscing elit. Nam quis sagittis mi. Nam id vestibulum arcu, ut maximus arcu. Vestibulum blandit lorem quam, ut auctor velit ornare eget. Donec eros nisi, egestas sed sem eu, facilisis venenatis nunc. Nunc metus nulla, ornare nec orci non, egestas aliquet urna. Proin semper lectus non luctus dignissim. In dapibus neque rhoncus nisi faucibus, in facilisis elit tincidunt. Etiam in vulputate urna. Pellentesque habitant morbi tristique senectus et netus et malesuada fames ac turpis egestas. Integer viverra sit amet lorem id tristique. Ut sagittis mattis nisi sit amet eleifend. In hac habitasse platea dictumst. In hac habitasse platea dictumst.
Thu, 11 April 2024 | housing inflation insurance
In an evolving market landscape shaped by external pressures, homeowner insurance rates have increased significantly over the past year. The period from 2023 to 2024 has been marked by shifts driven largely by climate change, economic turbulence, and technological advancements.
In 2023, regions vulnerable to natural disasters witnessed some of the most significant premium increases. For instance, California, frequently battling wildfires, saw homeowner insurance rates surge by an average of 18% year-over-year. Similarly, Florida and Louisiana, often in the path of destructive hurricanes, experienced increases of 22% and 25%, respectively, reflecting the heightened risk and cost of insuring properties in these areas.
These adjustments are a direct response to the escalating severity and frequency of climate-related disasters. According to the National Oceanic and Atmospheric Administration (NOAA), the number of significant climate events causing over $1 billion in damages each has doubled over the past decade, underlining the growing financial risk to insurers and homeowners alike.
The inflation rate, which hovered around 7% in 2023, significantly impacted the insurance sector by increasing the costs associated with home repairs and replacements. This economic pressure, coupled with supply chain challenges and a 5% increase in construction labor costs, contributed to a nationwide average insurance premium increase of approximately 10% from 2023 to 2024.
Despite the overarching trend of rising premiums, certain markets have shown signs of stabilization and even decreases in homeowner insurance costs. Innovations in construction and the wider adoption of smart home technology have played crucial roles in this trend. For example, in states like Texas and Arizona, where new building codes and technologies have been embraced, homeowners saw a modest premium reduction of about 3% in the last year.
Insurance companies have become increasingly receptive to the idea of personalized policies and preventive technologies. In 2023, insurers introduced discounts of up to 15% for homes equipped with smart technology that mitigates risks, such as water leak detectors and automatic shut-off systems.
Experts recommend homeowners conduct annual policy reviews to ensure their coverage meets their current needs at the best possible rate. Investments in disaster resilience and smart home technologies not only enhance safety and convenience but can also lead to substantial insurance savings.